
SHO Kinetic Energy Graph#
Part 1#
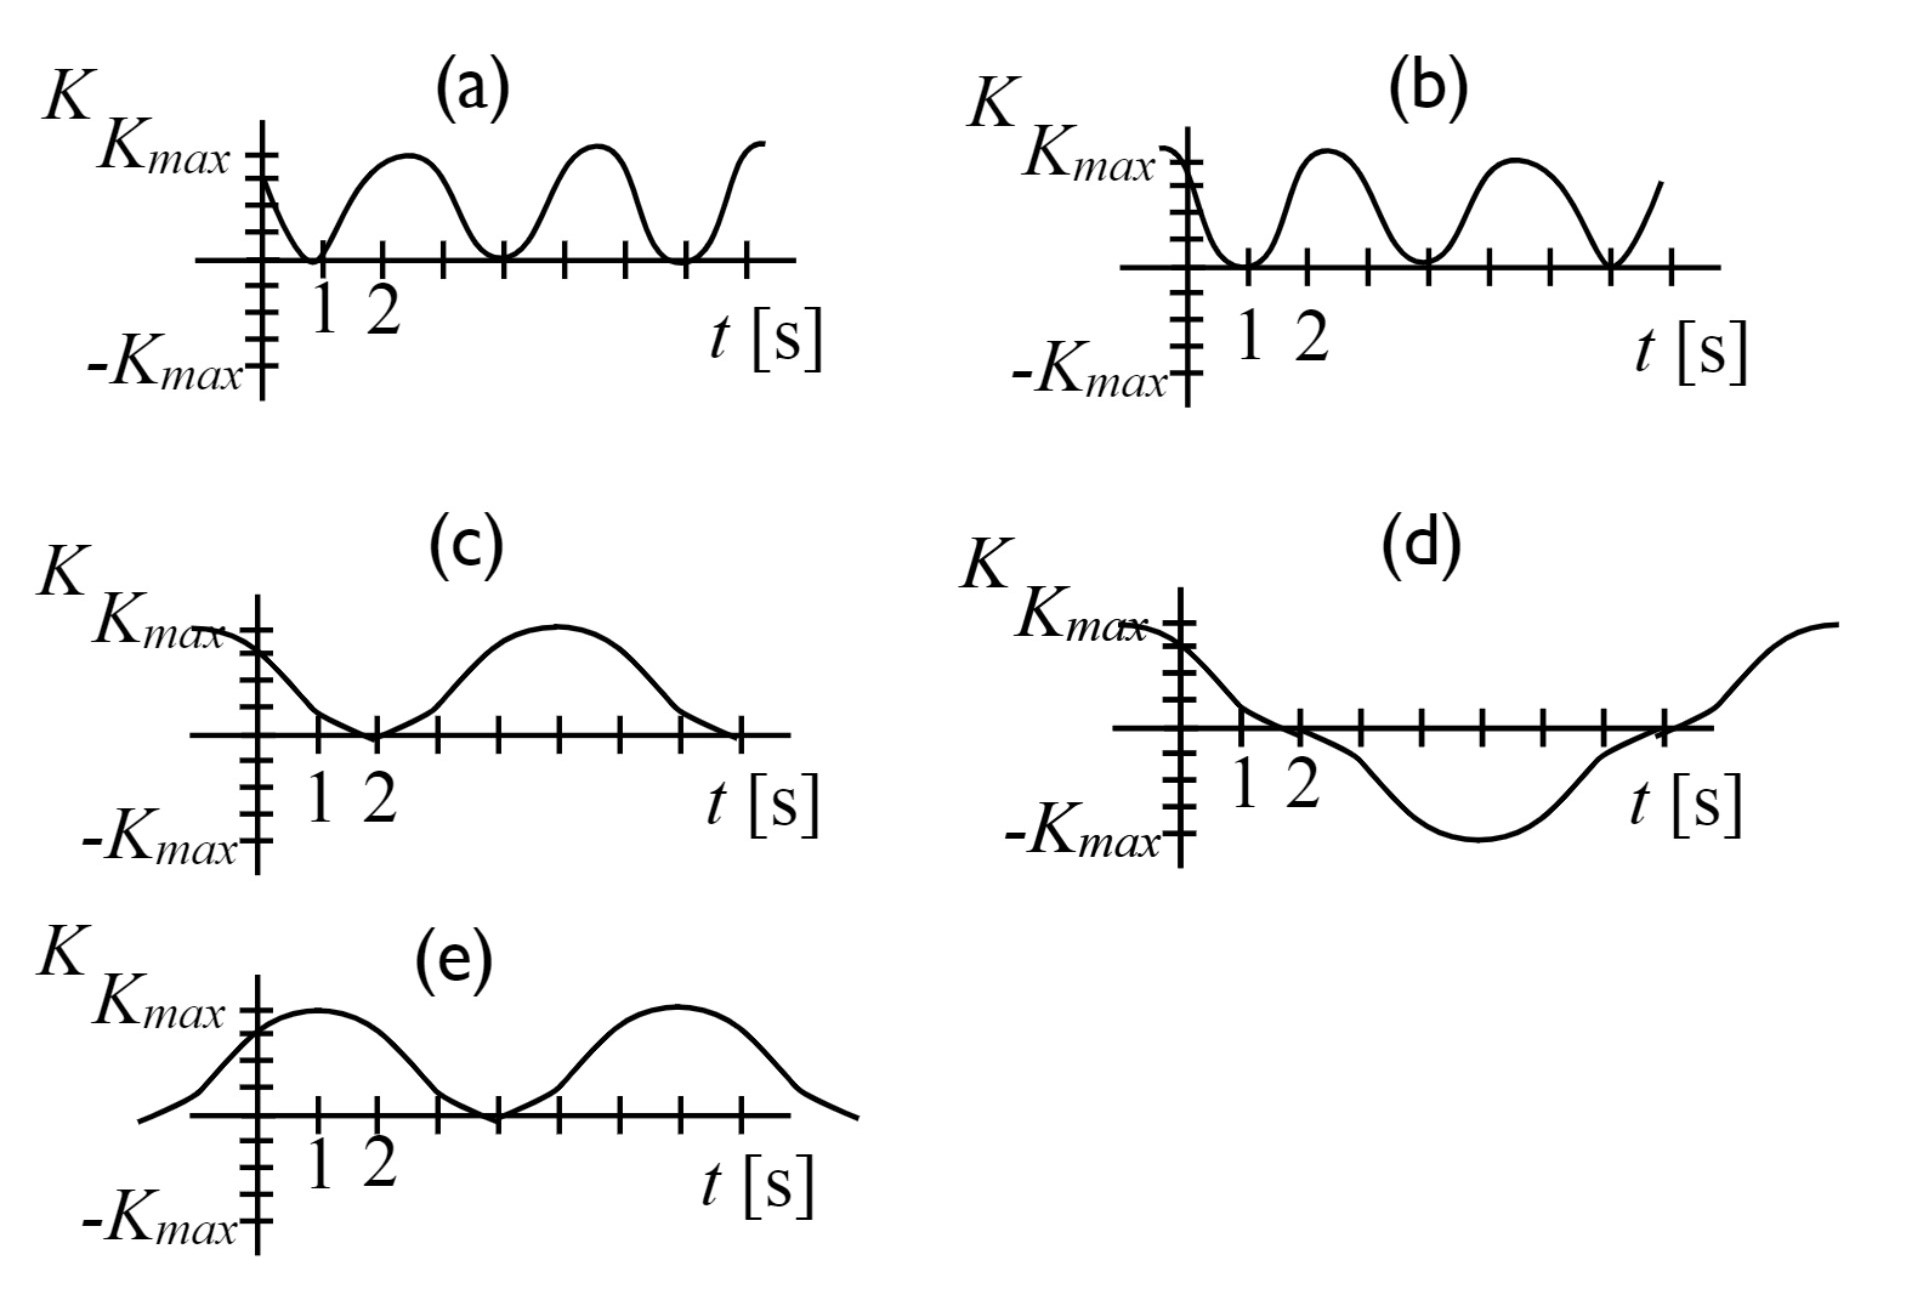
Identify which of the below graphs represents the kinetic energy as a function of time for a simple harmonic oscillator with displacement \(x(t) = A \cos \left( \frac{2\pi t}{12} - \frac{\pi}{3} \right)\)
Answer Section#
Figure A
Figure B
Figure C
Figure D
Figure E
Attribution#
Problem is licensed under the CC-BY-NC-SA 4.0 license.