
Velocity From Graph#
Refer to the following figure.
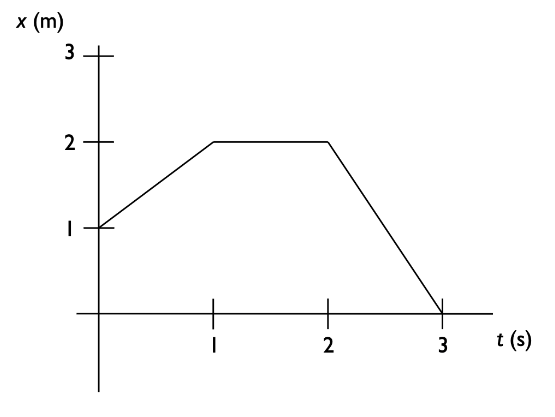
Figure: Position vs. time graph for the following two questions.
Part 1#
At \(t=\) 0.5\(s\), what is the x-component of the instantaneous velocity of the object whose position vs. time graph is shown in the figure?
Answer Section#
1 \(m/s\)
-0.5 \(m/s\)
-2 \(m/s\)
2 \(m/s\)
-1 \(m/s\)
Part 2#
For the object whose position vs time graph is shown in the figure above, the x-component of the average velocity (\(v\_{avg,x ; 0 \rightarrow 3}\)) and average speed (\(v\_{avg ; 0 \rightarrow 3}\)) over the time interval t=0s to t=3s are:
Answer Section#
\(v_{avg,x \; 0 \rightarrow 3}\) = -0.33 \(m/s\) and \(v_{avg \; 0 \rightarrow 3}\)= 1 \(m/s\)
\(v_{avg,x \; 0 \rightarrow 3}\) = -0.33 \(m/s\) and \(v_{avg \; 0 \rightarrow 3}\)= 0.33 \(m/s\)
\(v_{avg,x \; 0 \rightarrow 3}\) = -0.35 \(m/s\) and \(v_{avg \; 0 \rightarrow 3}\)= 0.5 \(m/s\)
\(v_{avg,x \; 0 \rightarrow 3}\) = -0.5 \(m/s\) and \(v_{avg \; 0 \rightarrow 3}\)= -2 \(m/s\)
\(v_{avg,x \; 0 \rightarrow 3}\) = -2 \(m/s\) and \(v_{avg \; 0 \rightarrow 3}\)= -0.5 \(m/s\)
Attribution#
Problem is licensed under the CC-BY-NC-SA 4.0 license.