
Graphs of Projectile Motion#
Part 1#
Which of the below sets of graphs is consistent with projectile motion? Assume that gravity acts in the negative \(y\)-direction.
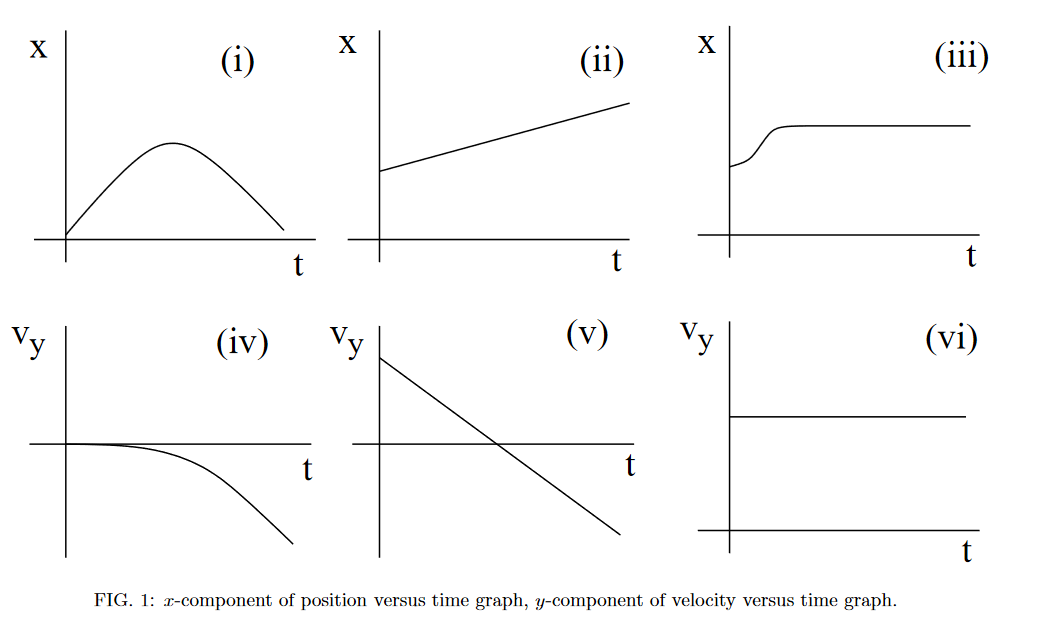
Long Description of image: Figure of six graphs.
- Graph (i) is a displacement-time graph and it has a symmetric peak shape. - Graph (ii) is a displacement-time graph. It is a straight line with a positive y-intercept. - Graph (iii) is a displacement-time graph. It starts at a positive y-value and forms the right half of a trough (concave up and increasing) before forming a horizontal line. - Graph (iv) is a velocity-time graph. It starts at the origin and then forms the right half of a peak (concave down and decreasing). - Graph (v) is a velocity-time graph. It is a straight line with negative slope and positive y-intercept. - Graph (vi) is a velocity-time graph. It is a horizontal line which crosses the vertical axis at a positive value.Long description ends.
Answer Section#
Graph (i)
Graph (ii)
Graph (iii)
Graph (iv)
Graph (v)
Graph (vi)
Attribution#
Problem is licensed under the CC-BY-NC-SA 4.0 license.