
Acceleration, Velocity and Time#
For this problem, refer to the following figure.
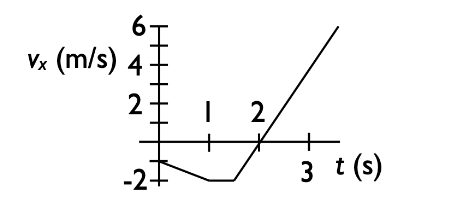
Top: The x-component of a velocity vs. time graph is shown for an object:
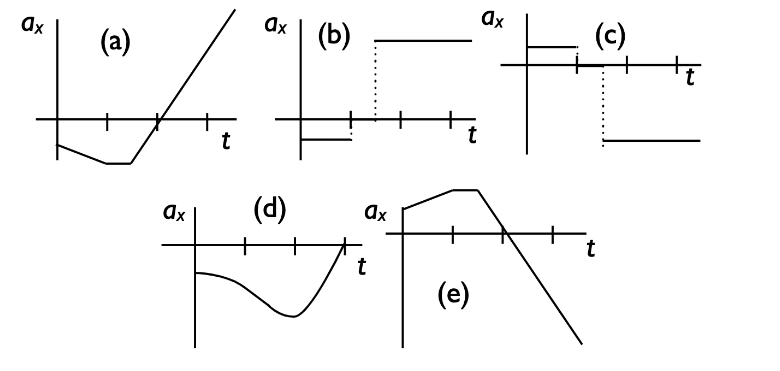
Bottom: Below are possible options of that same object’s “acceleration vs. time” graph:
Part 1#
Of the listed acceleration vs. time graphs shown in the bottom figure, which is consistent with the velocity vs. time graph shown in the top figure?
Answer Section#
Option A
Option B
Option C
Option D
Option E
Part 2#
If the initial position of the object whose velocity vs. time graph is shown in the figure (Top) is \(x_0\) = 0 \(m\), at what time does the object return to the position \(x\) = 0 \(m\) ?
Answer Section#
Never
3.225 \(s\)
1.5 \(s\)
2 \(s\)
2.866 \(s\)
Attribution#
Problem is licensed under the CC-BY-NC-SA 4.0 license.