
Choose the Correct Graph#
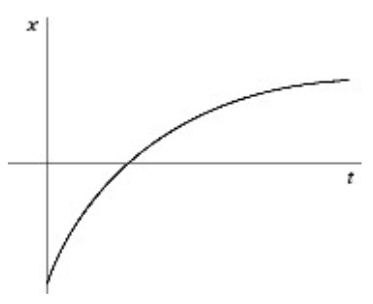
This figure shows the graph of the position \(x\) as a function of time \(t\) for an object moving in a straight line (along the \(x\)-axis):
Part 1#
Which of the following graphs best describes the velocity along the \(x\)-axis as a function of time for this object?
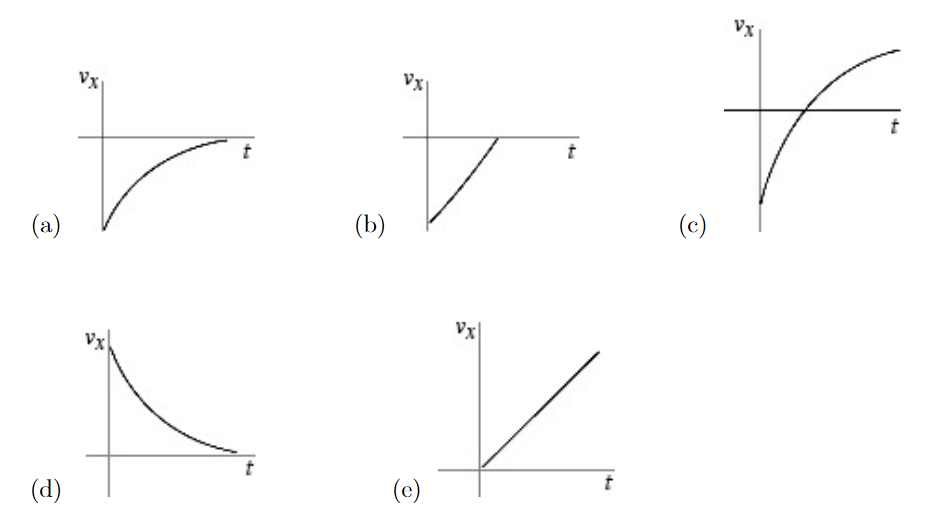
Long Description of image: Figure of answer options.
All of the figures are velocity-time graphs.Figure a shows a graph which starts at a negative y-value and which increases at a decreasing rate. The graph does not cross the x-axis.
Figure b shows a straight line which starts at a negative y-value and stops when it reaches the x-axis.
Figure c shows a graph which starts at a negative y-value and which increases at a decreasing rate. The graph crosses the x-axis.
Figure d shows a graph which starts at a positive y-value and which decreases at a decreasing rate.
Figure e shows a straight line with a positive slope starting at the origin.
Long description ends.
Answer Section#
Figure (a)
Figure (b)
Figure (c)
Figure (d)
Figure (e)
Attribution#
Problem is licensed under the CC-BY-NC-SA 4.0 license.