Collisions and Isolated Systems Graphs#
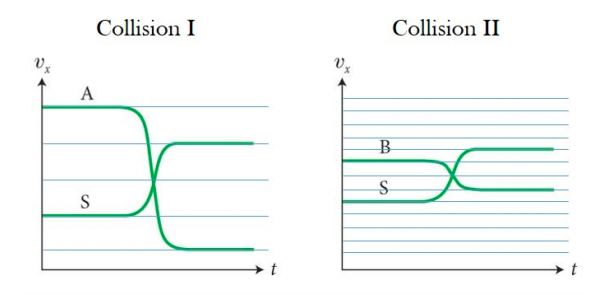
The figure below shows the velocity versus time graphs of two different collisions. The graph on the left shows a collision between cart A and cart S. The graph of the right shows a collision between cart B and cart S.

Part 1#
If \(\frac{m_A}{m_S}\) = 1/2 and \(\frac{m_B}{m_S}\) = 3, for which of the collisions is the system of carts an isolated system?
Answer Section#
I
II
I & II
Neither
Attribution#
Problem is licensed under the CC-BY-NC-SA 4.0 license.

