
Position, Velocity and Acceleration#
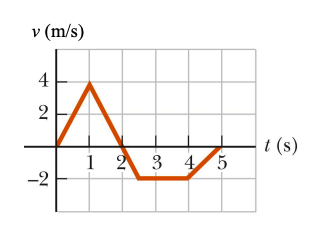
The figure shows the velocity-versus-time graph for a particle moving along the x-axis. Its position at \(t\) = 0 s is -2 \(m\).
Part 1#
What is the particles velocity at \(t\) = 1 \(s\)? If the answer is undefined, enter 100.
Answer Section#
Please enter in a numeric value in \(m\).
Part 2#
What is the particles position at \(t\) = 1 \(s\)? If the answer is undefined, enter 100.
Answer Section#
Please enter in a numeric value in \(m/s\).
Part 3#
What is the particles acceleration at \(t\) = 1 \(s\)? If the answer is undefined, enter 100.
Answer Section#
Please enter in a numeric value in \(\frac{m}{s^2}\).
Attribution#
Problem is licensed under the CC-BY-NC-SA 4.0 license.