
Label Velocity Vs Time Graph#
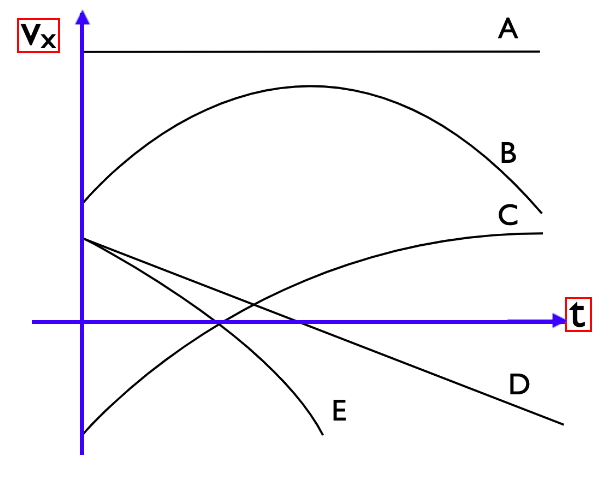
The following is a figure of velocity vs. time. Each of the following 5 statements below describe the motion shown in the figure labeled A through E. Label each statement with the letter of the corresponding line on the velocity vs. time graph.
Part 1#
An object slows down, reverses and speeds up with a constant acceleration.
Answer Section#
A
B
C
D
E
Part 2#
An object slows down, reverses and speeds up with an increasing magnitude acceleration.
Answer Section#
A
B
C
D
E
Part 3#
An object speeds up with a decreasing magnitude acceleration before slowing down with an increasing magnitude acceleration.
Answer Section#
A
B
C
D
E
Part 4#
An object travels at a constant speed.
Answer Section#
A
B
C
D
E
Part 5#
An object slows down, reverses and speeds up with a decreasing magnitude acceleration.
Answer Section#
A
B
C
D
E
Attribution#
Problem is licensed under the CC-BY-NC-SA 4.0 license.