Particle Energy to Force Diagram#

Question Text#

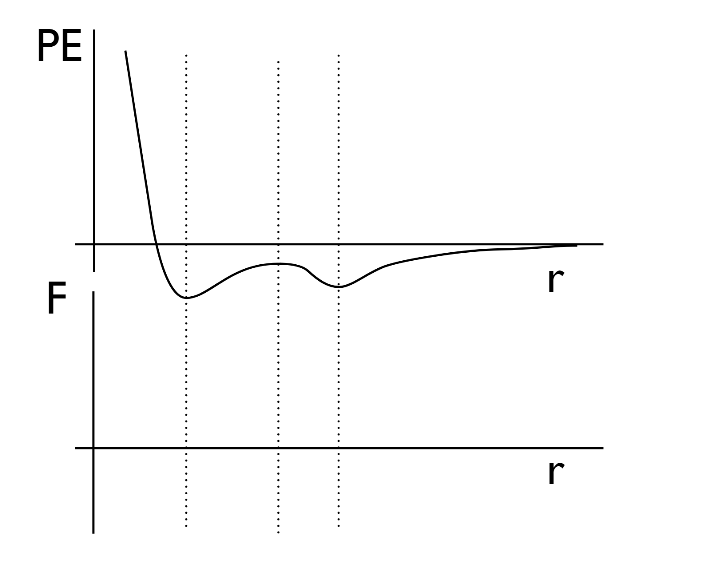
The potential energy of a particle in a conservative potential is shown below in Fig. 1. Sketch the force diagram as a function of radius for this particle. Save the diagram and use the provided dashed lines to guide your diagram.

Please upload the final diagram as a pdf titled “diagram.pdf”.

The top diagram is of a potential energy vs. radius graph. The graph is divided into four sections, with three dotted vertical lines marking the boundaries. The first section, beginning from the origin, starts from y = positive infinity, and dips sharply downwards below the x-axis, before curving gently (still below the x-axis), going from a negative slope to a gradual horizontal slope. In the second section, the horizontal slope curves into a positive slope, still underneath the x-axis, before decreasing into a horizontal slope again, still under the x-axis. In the third section, the graph dips downwards into another, smaller curve than the first until it reaches a horizontal slope. In the fourth section, it curves upwards, reaching an asymptote at y = 0. To recap, there is first a steep downwards decline from infinity, then 2 valleys (a hill between them), the first larger than the second, before gradually plateauing into the asymptote. The first and third dividing lines are right on the troughs of each valley, where slope = 0. The second dividing line is at the peak of the hill, where slope = 0. The graph below is of Force vs. radius, with the dotted dividing lines in the same area for reference.

Answer Section#

File upload box will be shown here.

Attribution#

Problem is licensed under the CC-BY-NC-SA 4.0 license.
The Creative Commons 4.0 license requiring attribution-BY, non-commercial-NC, and share-alike-SA license.