Position to Velocity Graph

Position to Velocity Graph#

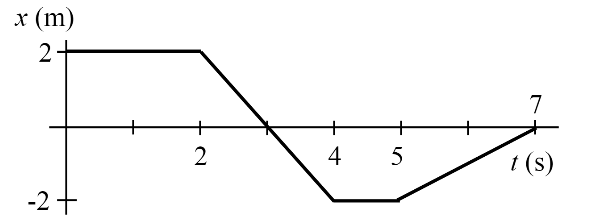
A position vs. time graph is shown. On the velocity versus time graph below it, sketch the corresponding velocity as a function of time. Show all calculations, and label the axes appropriately.

This is an image of a position (m) vs. time (s) graph. The y-axis is labelled 'x (m)' and ranges from -2 to 2. The x-axis is labelled 't (s)' and ranges from 0 to 7 seconds, each in 1 second increments. From 0s to 2s, it is a constant 2 metres. From 2s to 4s, there is a downwards linear slope: 2m at 2s, 0m at 3s, and -2m at 4s. From 4s to 5s it is a constant -2m. From 5s to 7s it is a steady upwards linear slope; -2m at 5s and 0m at 7s.

Question Text#

Please save this image to use for sketching the graph.

This image is of an empty velocity vs. time graph. The y-axis is labelled 'v_x (m/s)' while the x-axis is labelled 't (s)'. There are 7 equidistant empty line markings along the x-axis.

Upload your final graph as a pdf file titled “velocity.pdf”.

Answer Section#

File upload box will be shown here.

Attribution#

Problem is licensed under the CC-BY-NC-SA 4.0 license.
The Creative Commons 4.0 license requiring attribution-BY, non-commercial-NC, and share-alike-SA license.