Task 3
Contents
Task 3#
3.1 - Transformation#
Create a fourth sheet called transform that contains a table where each row is a time and each column contains values for the sensor. (Hint: Insert a table or use Cell References to get the data, i.e. don’t just copy paste the data)
Create data table.
Replace missing values with NA(). More info and Using ISNA() function
Add sparklines in last column for each row.
Add conditional formatting so that cells with #N/A are filled in red and cells with values >= 90 are filled in green.
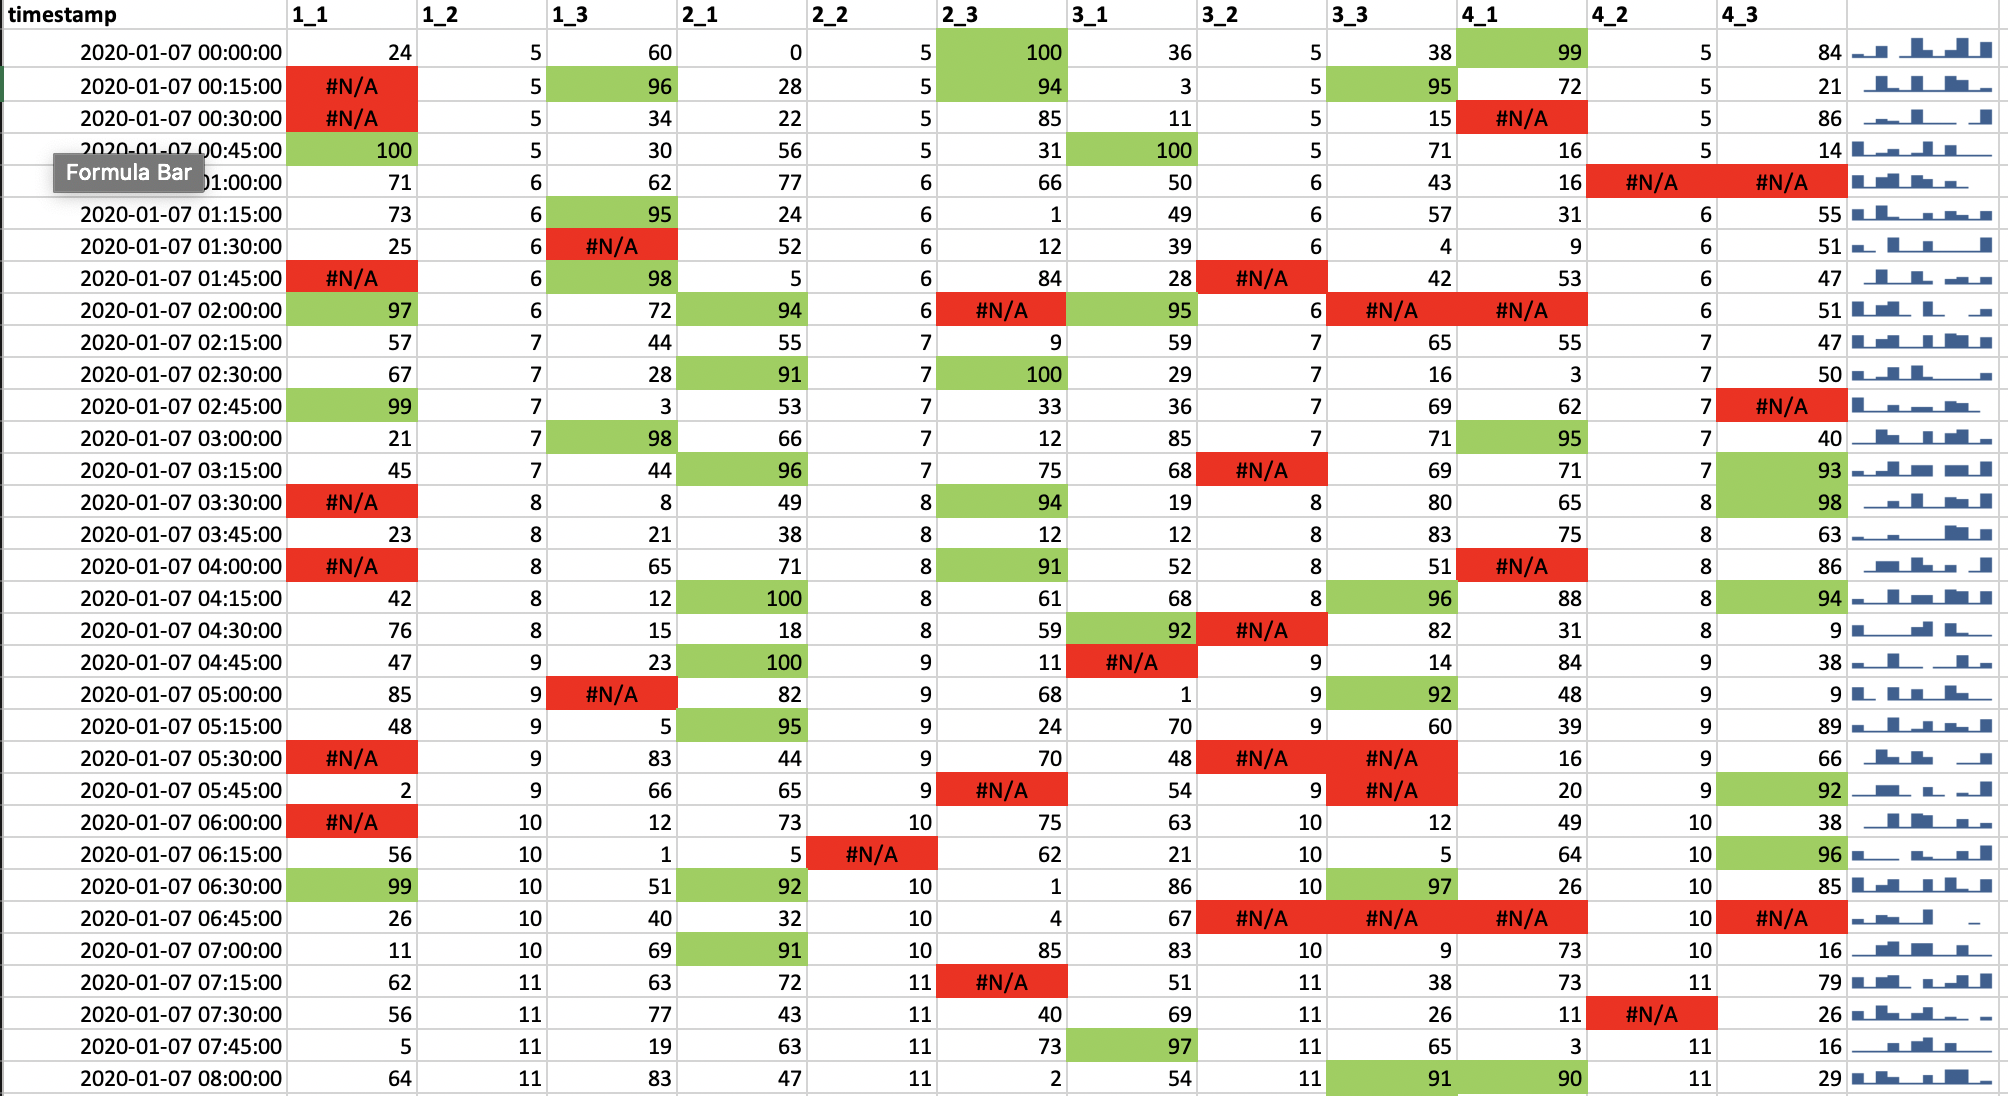
transform tab#
Your final output for the transform sheet should look similar to the screenshot provided below:
SUBMISSION DETAILS:#
Submit ONE Screenshot of the
transformsheet with cell B2 selected so we can see what formula you used in the formula bar.