Class 1A - Introduction to COSC 301
Contents
Class 1A - Introduction to COSC 301#
Welcome!

About Me#
Essence of this course#
The overall goal of this course is for you to:
Understand data analytics and be able to apply data analysis to data sets using a variety of software tools and techniques.
The most exciting aspect of data analytics is discovering and presenting useful data/information that can have an impact on business, society, etc.
This course will provide the tools and skills for you to perform your own data analysis when encountering problems in the real-world.
As an introductory course, the goal is to get exposure to the skills and techniques as there will not be time for mastery.
An Introduction to Data Analytics#
Data Analysis vs Data Analytics#
Data Analysis:
Data analysis is the processing of data to yield useful insights or knowledge.
Data Analytics:
Data Analytics is the science of examining raw data with the purpose of drawing conclusions about that information.
The distinction between data analysis and analytics is blurry to say the least (even Wikipedia is confused).
One source might say that data analysis is a subcomponent of data analytics, while another source says data analytics is a sub-component of data analysis.
I like to think of data analysis as the method (ie action) whereas data analytics are tools used to do so. Analytics is supported by many tools such as Git, Python, Tableau, Microsoft Excel all of which we will talk about in this course.
There are many other popular tools in Data Analytics such as Microsoft Access, SQL, Docker, and others which we won’t talk much about in this course, but I will provide you some resources and references if you would like to learn more about this.
Why is Data Analytics important?#
Data analytics is important as society is collecting more and larger data sets all the time:
Web All web pages visited and links clicked, searches made, images and posts
Business Items purchased by date, supply chain/customers, industrial sensors
Science Massive data sets (biological/genomic, astronomy, physics, healthcare)
Environmental Sensors and monitors (temperature, etc.)
Transforming this raw data into useful insights has major value:
Web Online advertising driven by understanding customer behaviour; tailored google searches, Google Analytics
Business Sales predictions, marketing promotions, manufacturing improvement
Science Scientific discoveries, new medical treatments and drugs; see some examples in healthcare.
Environmental Understanding of environmental processes to allow for changing policies and behaviours, eg Institute of Environmental Analytics
Why is this course important?#
For some of you, this will be your first exposure to programming and data analytics.
Regardless of your discipline, the tools you develop throughout this course will train you to think analytically and creatively.
Beyond University, many professional jobs of the future will involve collecting, manipulating, and analyzing data.
People who can understand how data can be used will have better employment opportunities.
Important skills you may learn in this course:
Excel Proficiency: for general data analysis and productivity.
Programming and Computational Thinking: Critical thinking and the ability to clearly articulate a problem in a systematic way has applications beyond data analytics.
Data visualization: how to display and convey information in a meaningful way.
Real-world problem solving: learn to tackle real-world data analysis problems and understand when to use what tool.
Optional, resources provided if you’re interested
Databases: Understand how they work and how to use them.
Applied Statistics: Using software makes your statistics training useful for real-world problems.
What will I learn in this course?#
Understand data representation formats and techniques and how to use them.
Work with large datasets and learn to manipulate them programmatically.
Experience using a wide-range of data analytics tools including Excel, Git, Python, Pandas, Tableau, and other visualization packages and software.
Develop a computational thinking approach to problem-solving and use programs to solve data tasks.
Why should You take this course?#
This course is one of my favourite courses to teach at UBCO!
It was initially created by Dr. Ramon Lawrence, and has since been updated by various folks including Dr. Patricia Lasserre, Dr. Firas Moosvi, Dr. Irene Vrbik, Dr. Scott Fazackerley, and others.
It is a fantastic introduction to the field of Data Science and in this one course, you will be equipped to handle most of the common Data wrangling, processing, and analysis tasks.
You will also be introduced to a variety of tools (tech stack) that are common in the industry, and we hope you use this course as a spring board to launch your interest in Data Science!
Course Introduction#
Let’s talk about some of the details of course logistics and how we’ll do things in this course.
Grading Scheme#
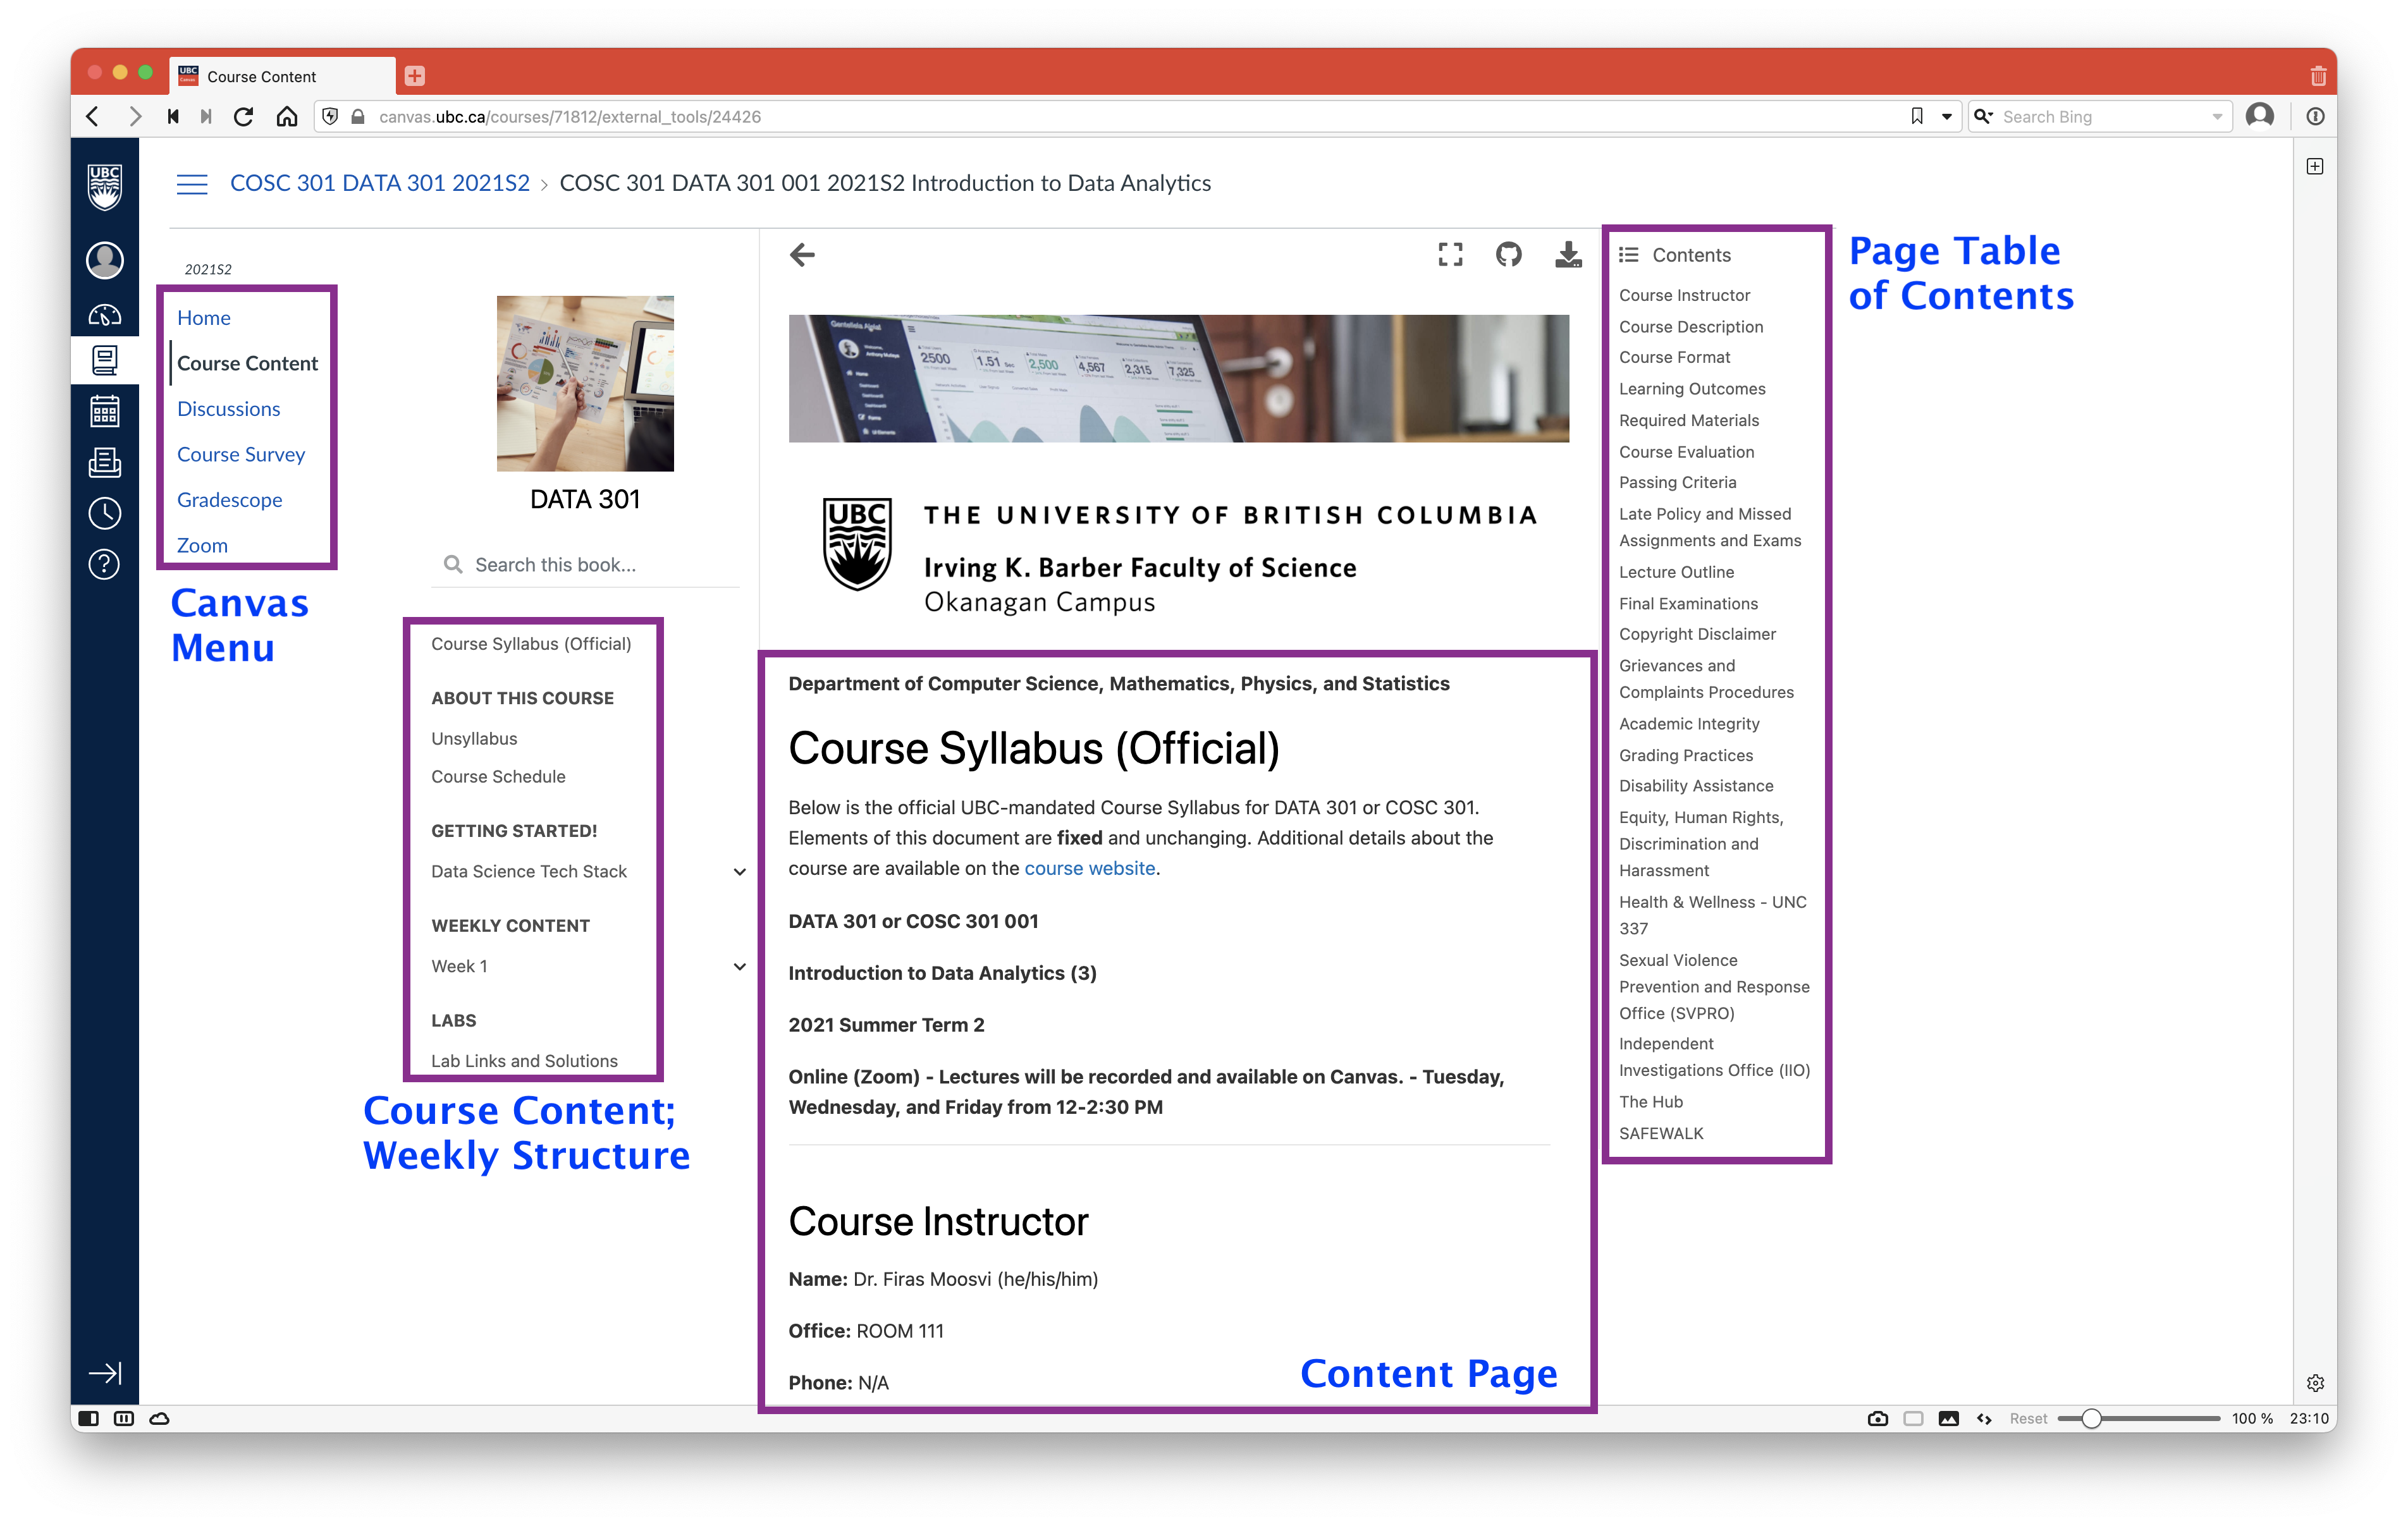
Course Website#
Demo of Hypothesis#

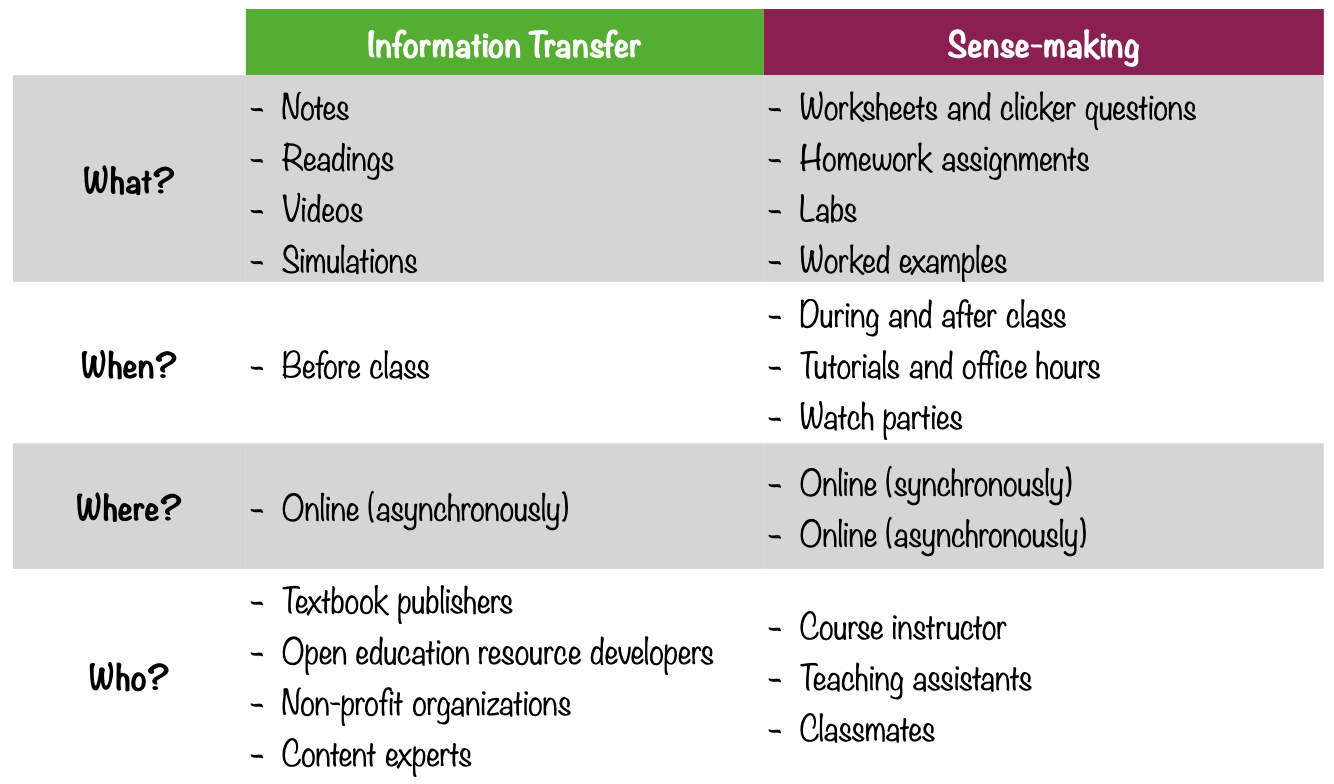
Research on Learning#
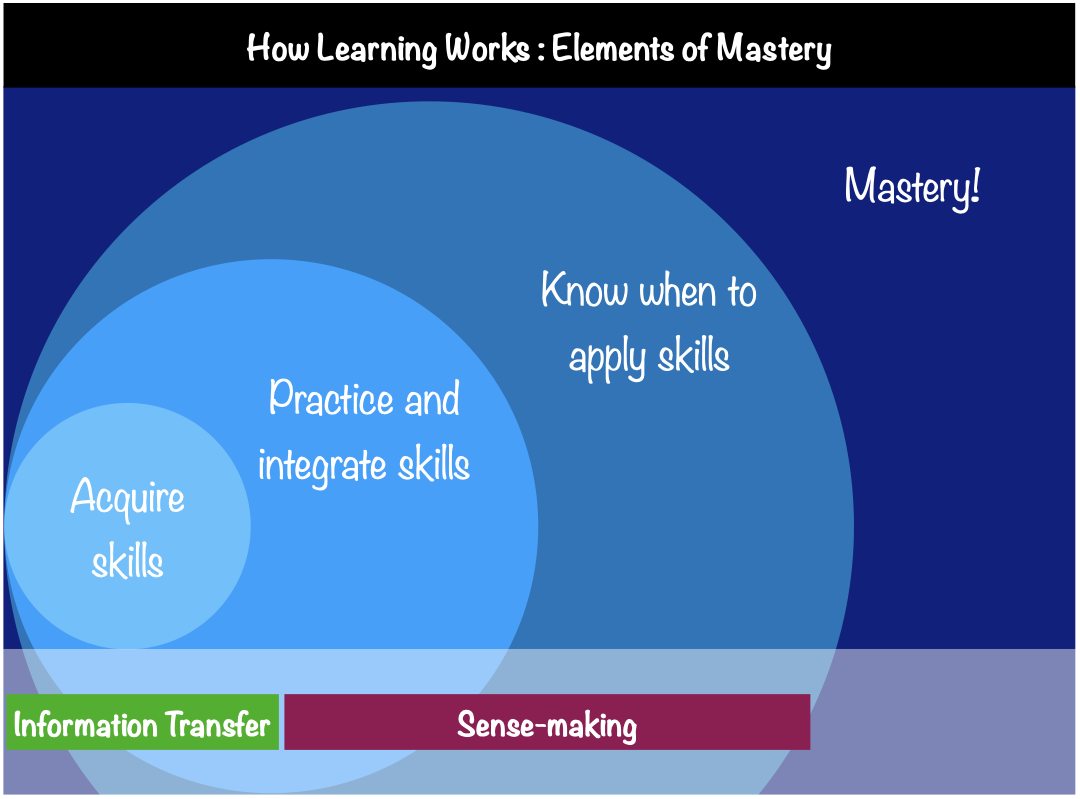
Learning in this course#
Course features#
48 hour grace-period on all due dates and deadlines.
Lab attendance is not mandatory (attend any and all sections that work for you).
Classes are recorded, but not live streamed. Recordings are available 24-48 hours after the class.
Many opportunities to demonstrate your learning.
Weekly learning logs and reflections to make you think about your learning (metacognition).
Each test has a “bonus test” available one week later; for each test, we will take the better score of the pair.
No high-stakes exams (the single largest assessment item is the final exam).
All course assessments are completely open book, open notes, and open web (except for cheating websites like Chegg, CourseHero, Slader, Bartleby, etc…)
Plenty of TA and instructor student hours and several outside of normal business hours.
Class website that outlines exactly what you should do when to help you manage your time.
Tonnes of supplemental materials including other - instructional videos in case you want a different perspective.
Weekly prompt to accept the integrity pledge to keep you accountable.
A true willingness from the instructor (me) to help you learn and succeed in this course!
Introduction to Ed Discussion#
To manage student support requests and help everyone as efficiently as possible, we will be using Ed Discussion.
This is a tool being piloted at UBC and we’re on the cutting edge!
It is essential that you get on Ed Discussion ASAP!
I will not be able to answer student emails or Canvas messages
If you email me accidentally, that’s okay! I have set up a script that auto-replies reminding you to post on Ed Discussion :-)
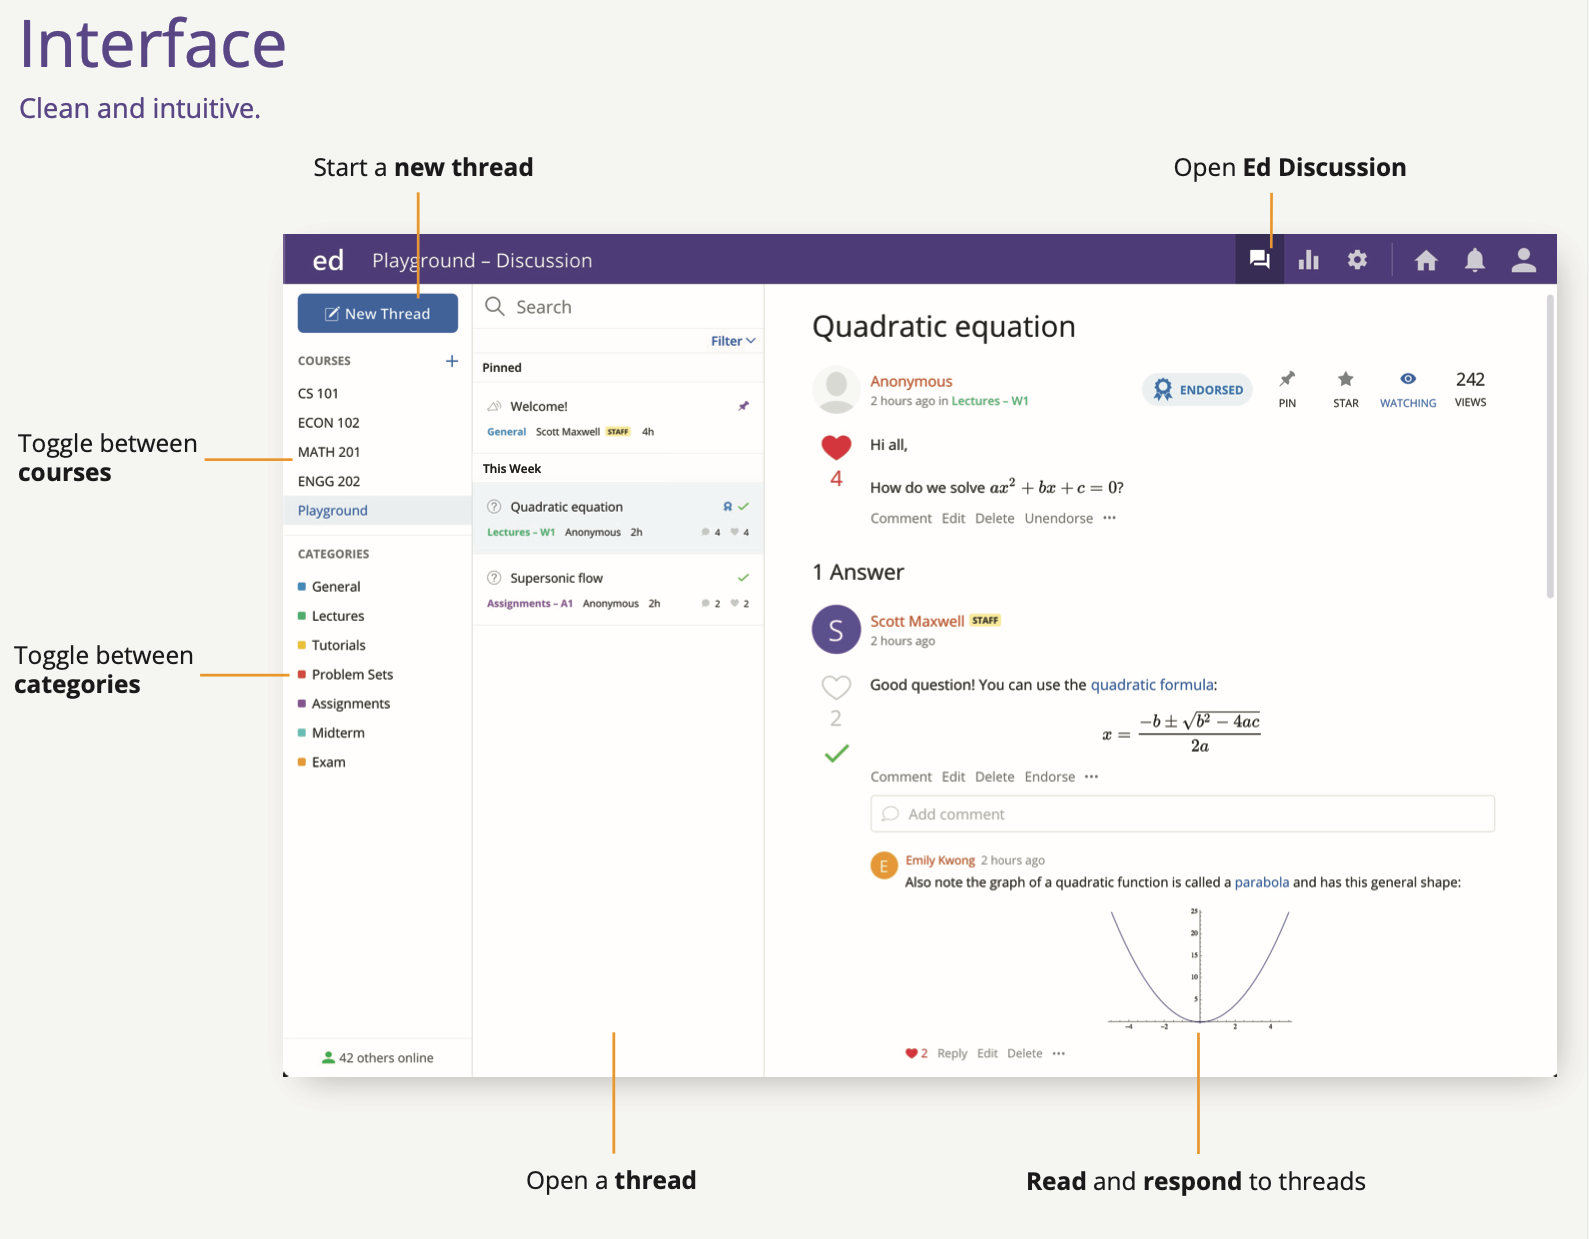
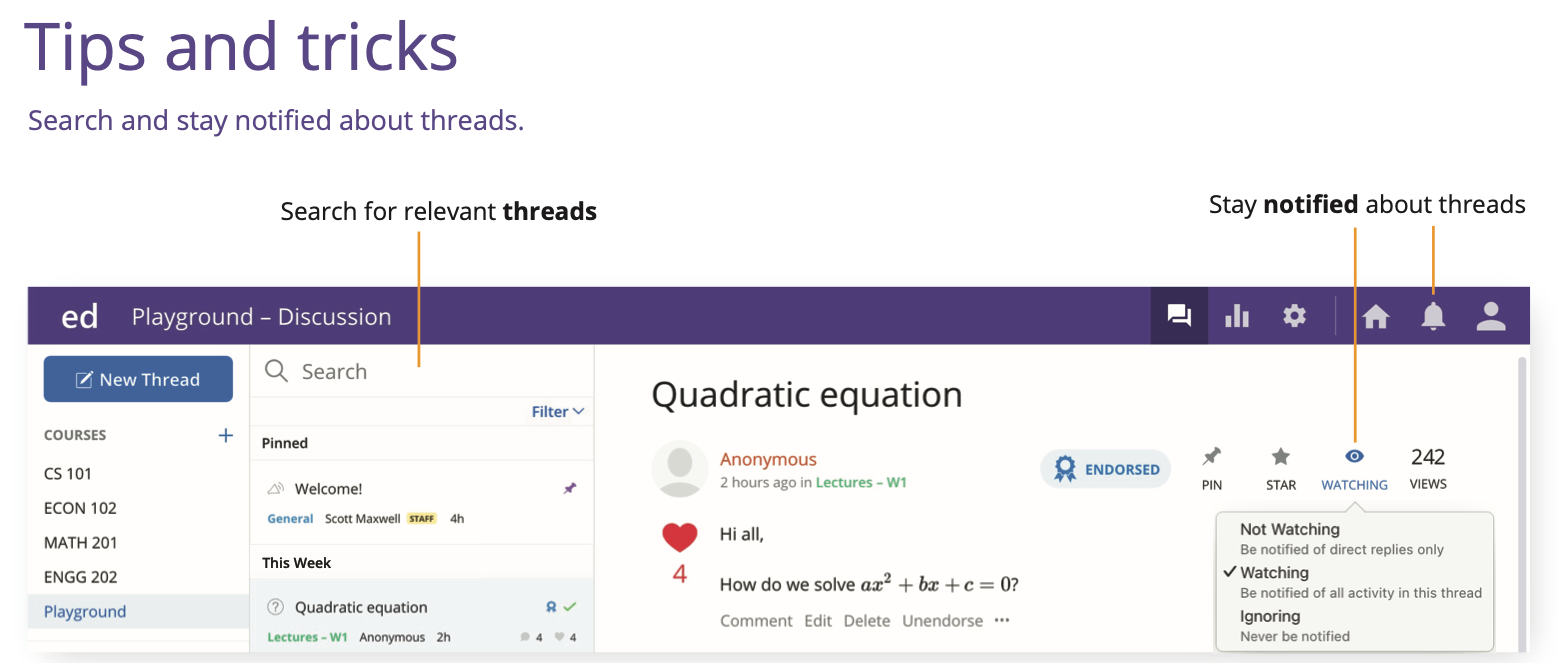
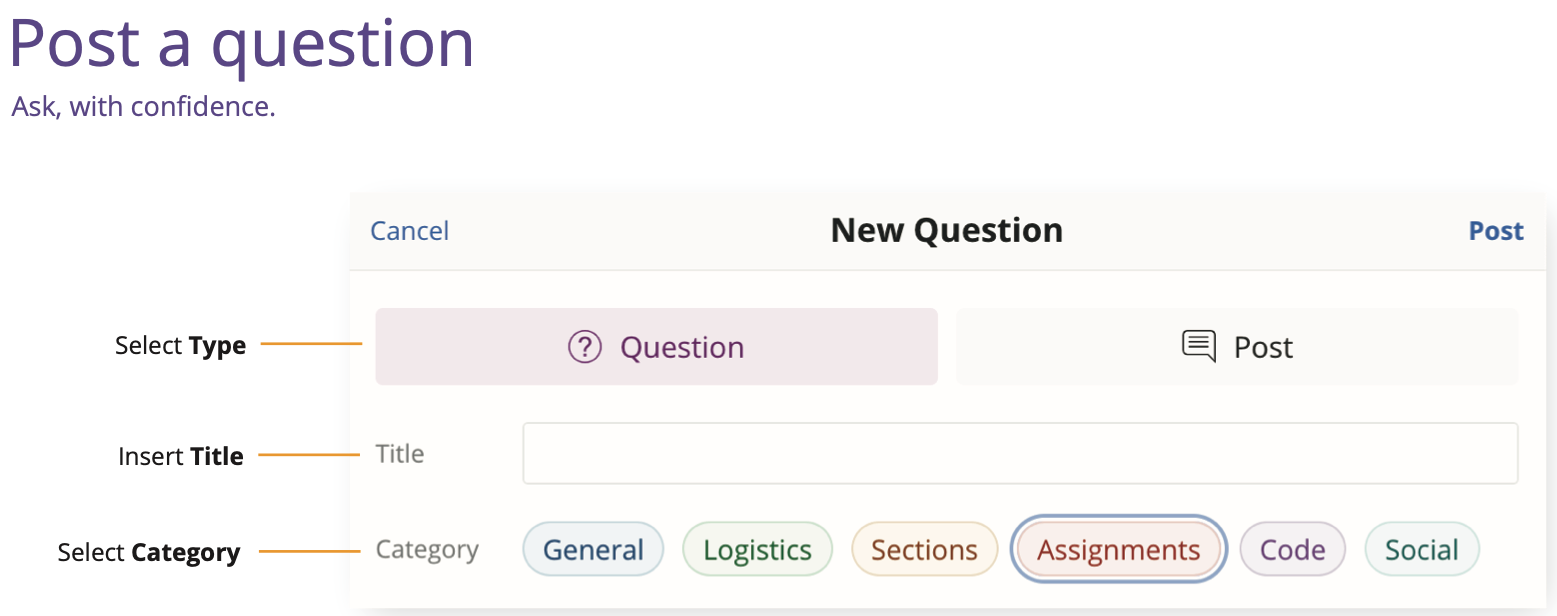
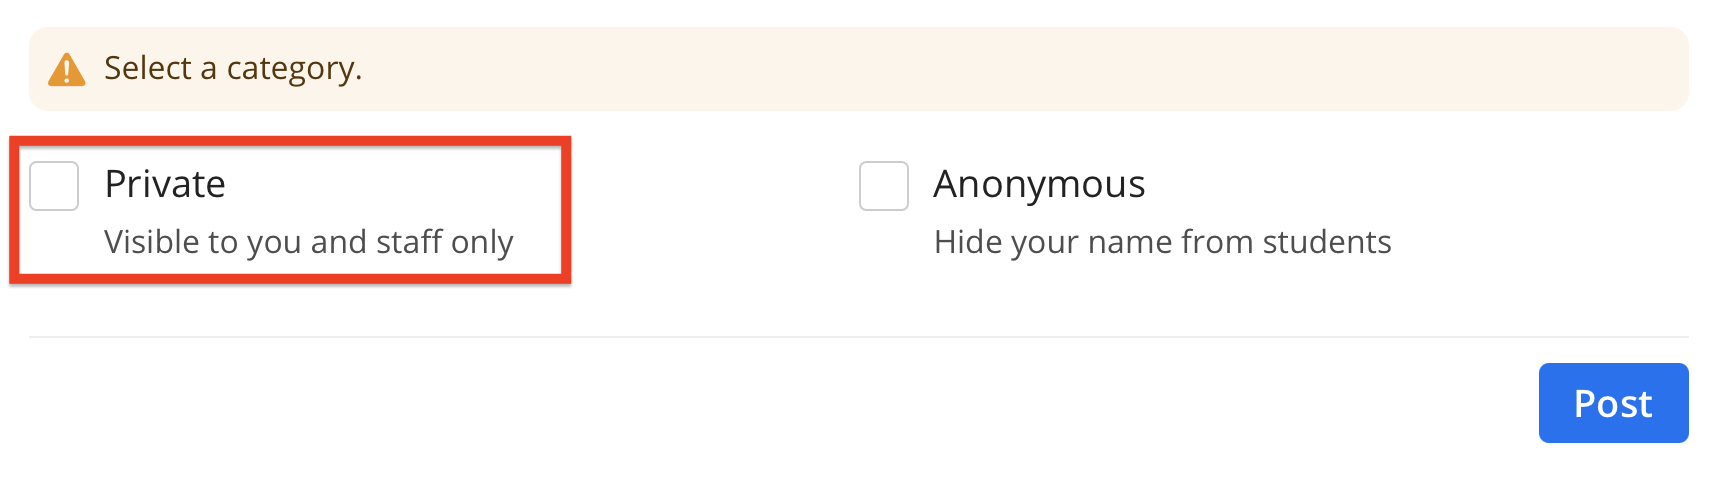
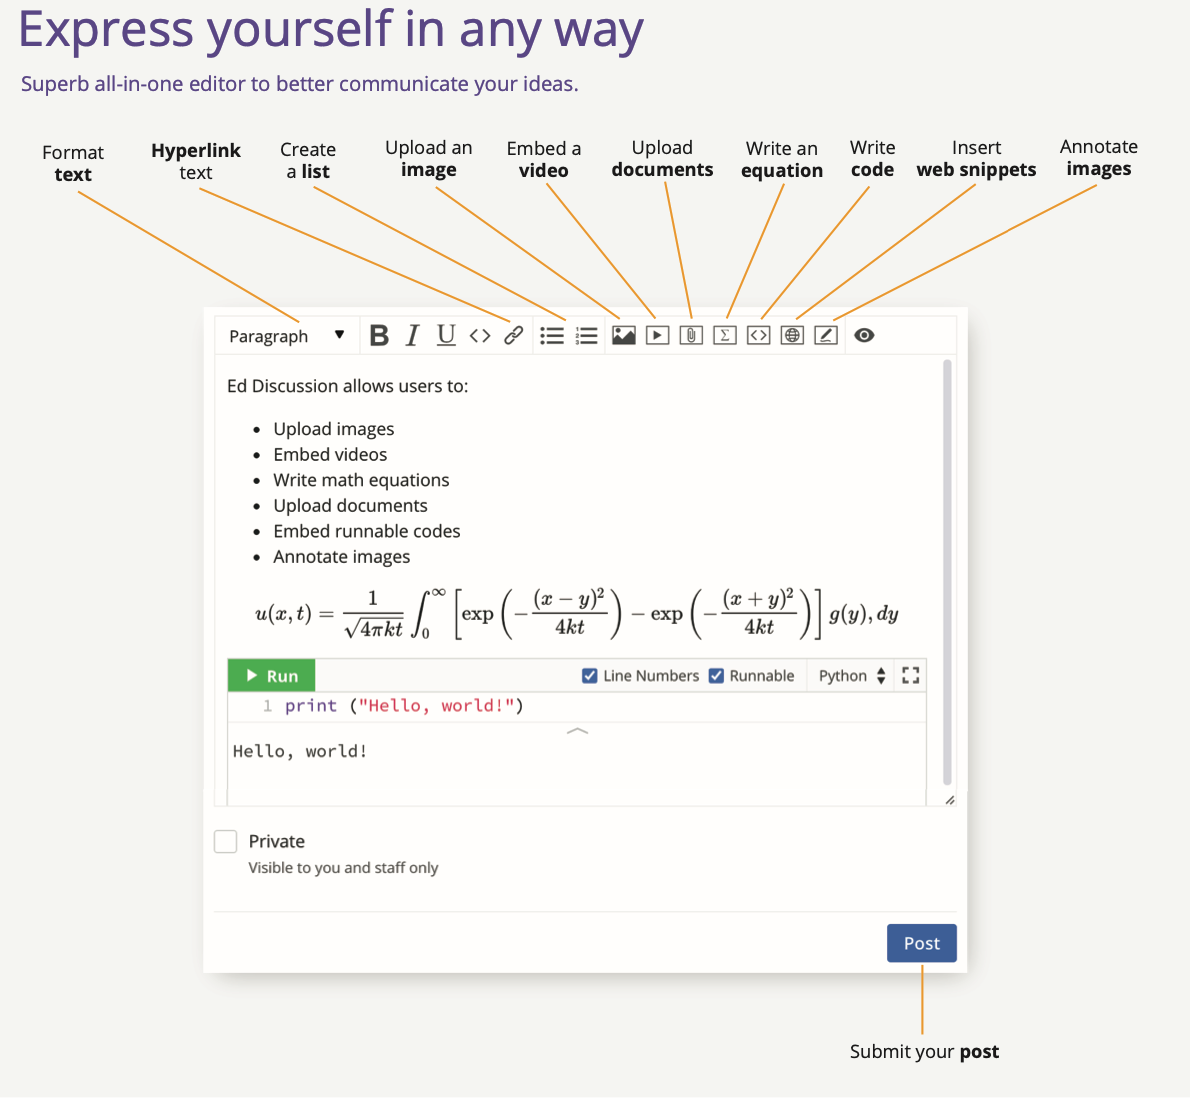
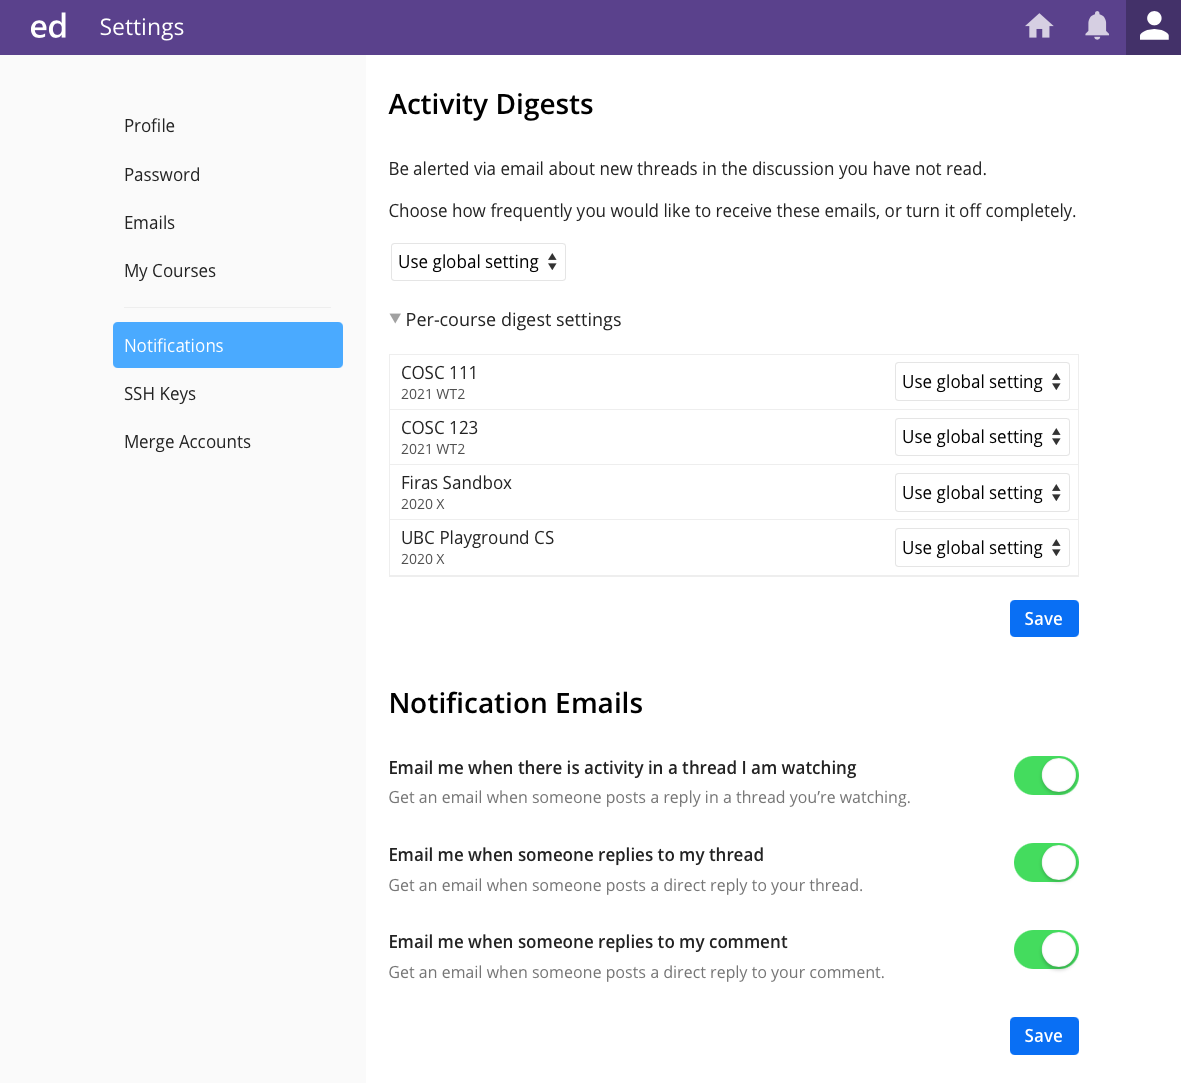
Demo of Ed Discussion#
Introduction to Gradescope#
In a course like this, it is essential for us to have a smooth process to deliver feedback to you as quickly and efficiently as possible.
Why are we using Gradescope?#
Tried Canvas last year, it has HUGE efficiency issues for grading.
Gradescope has GitHub integration, Canvas does not.
Gradescope is better for providing feedback to students.
Students don’t seem to mind it 🤷🏽♂️.
That’s it!#
See you next class!