Lecture 9A - Motivating the need for EDA
Contents
Lecture 9A - Motivating the need for EDA#
We will begin soon! Until then, feel free to use the chat to socialize, and enjoy the music!

Announcements#
There were a couple of minor errors in Test 2
I’ll take a look and may adjust things if necessary, but I suggest you do the bonus test instead to be sure
Bonus Test 2 will be this Thursday starting at 3:30 PM
Read over the entire test before you start it!
For Bonus Test 2 and Test 3 only, the tests will be done virtually, so don’t come to class!
We will return to regularly scheduled class tests with Bonus Test 3 and Test 4
Discussion about Project Milestone 3
Class Outline#
Project milestone 3
Motivating Exploratory Data Analyses (30 mins)
Review of some concepts so far.
Project Milestone 3#
Some good Examples from previous years:
Motivating the need for EDA#
bullet_data.csv is available here: https://github.com/firasm/bits/raw/master/bullet_data.csv
import pandas as pd
import seaborn as sns
import numpy as np
import matplotlib.pyplot as plt
#from pandas_profiling import ProfileReport

sns.set_theme(style="white", font_scale=1.3)
df = pd.read_csv("https://github.com/firasm/bits/raw/master/bullet_data.csv")
df.head()
| x | y | bullet | zone | |
|---|---|---|---|---|
| 0 | 0 | 0 | 0.0 | OutsidePlane |
| 1 | 0 | 1 | 0.0 | OutsidePlane |
| 2 | 0 | 2 | 0.0 | OutsidePlane |
| 3 | 0 | 3 | 0.0 | OutsidePlane |
| 4 | 0 | 4 | 0.0 | OutsidePlane |
# Use our standard tool first:

df.describe().T
| count | mean | std | min | 25% | 50% | 75% | max | |
|---|---|---|---|---|---|---|---|---|
| x | 87500.0 | 124.500000 | 72.168619 | 0.0 | 62.0 | 124.5 | 187.0 | 249.0 |
| y | 87500.0 | 174.500000 | 101.036462 | 0.0 | 87.0 | 174.5 | 262.0 | 349.0 |
| bullet | 68526.0 | 0.008741 | 0.093086 | 0.0 | 0.0 | 0.0 | 0.0 | 1.0 |
# let's do some of this work manually

print("The zones are: {0}".format(sorted(set(df["zone"]))), "\n")

print("Columns are: {0}".format(list(df.columns)), "\n")

print("Values for 'bullet' column is {0}".format(sorted(df["bullet"].unique())), "\n")
The zones are: ['A', 'B', 'C', 'D', 'E', 'OutsidePlane', 'Unknown']

Columns are: ['x', 'y', 'bullet', 'zone']

Values for 'bullet' column is [0.0, nan, 1.0]
Let’s wrangle the data a bit to try and see what’s going on:
# First, only consider the bullet 'hits':

hits_df = df[df["bullet"] == 1]
hits_df.sample(5)
| x | y | bullet | zone | |
|---|---|---|---|---|
| 33372 | 95 | 122 | 1.0 | B |
| 33386 | 95 | 136 | 1.0 | B |
| 27835 | 79 | 185 | 1.0 | B |
| 81347 | 232 | 147 | 1.0 | E |
| 32385 | 92 | 185 | 1.0 | B |
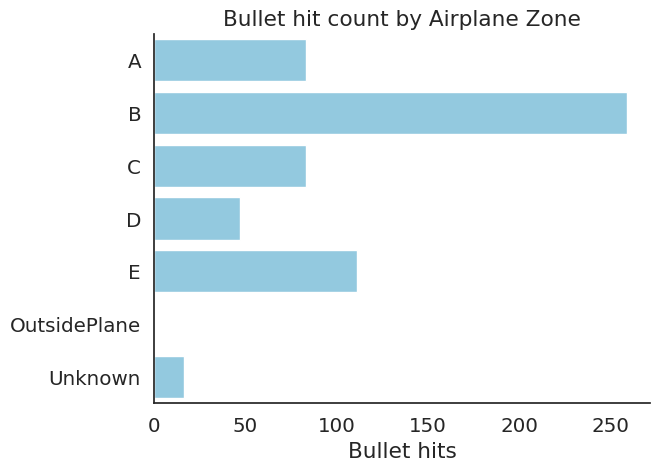
# Then, let's groupby the "zone" and look at the resulting dataframe
# I have "reset" the index of the groupby object so we can have a continuous index
summary = hits_df.groupby("zone").count().reset_index()
summary
| zone | x | y | bullet | |
|---|---|---|---|---|
| 0 | A | 83 | 83 | 83 |
| 1 | B | 259 | 259 | 259 |
| 2 | C | 83 | 83 | 83 |
| 3 | D | 47 | 47 | 47 |
| 4 | E | 111 | 111 | 111 |
| 5 | Unknown | 16 | 16 | 16 |
# Now let's visualize the table above:

sns.countplot(data=hits_df, y="zone", order=sorted(set(df["zone"])), color="skyblue")
plt.ylabel("")
plt.title("Bullet hit count by Airplane Zone")
plt.xlabel("Bullet hits")
sns.despine()
# Another Visualization

df["outline"] = np.where(df["zone"] == "OutsidePlane", 0, 1)

sns.heatmap(data=df.pivot("x", "y", "outline"), cmap="Greys")
plt.axis("off")
/tmp/ipykernel_2304/1241529657.py:5: FutureWarning: In a future version of pandas all arguments of DataFrame.pivot will be keyword-only.
  sns.heatmap(data=df.pivot("x", "y", "outline"), cmap="Greys")
(0.0, 350.0, 250.0, 0.0)

sns.heatmap(data=df.pivot("x", "y", "bullet"), cmap="Spectral")
plt.axis("off")
/tmp/ipykernel_2304/430024000.py:1: FutureWarning: In a future version of pandas all arguments of DataFrame.pivot will be keyword-only.
  sns.heatmap(data=df.pivot("x", "y", "bullet"), cmap="Spectral")
(0.0, 350.0, 250.0, 0.0)

Debrief#
COSC 301 Review#
Review Session Outline#
Writing For loops from scratch
Practice Questions
Writing Assert statements
Difference between try/except and assert
Defining functions in a .py file
Method Chaining
GroupBy vs. Merge
## Data and imports

import pandas as pd
import seaborn as sns
import numpy as np

pokemon = pd.read_csv("https://github.com/firasm/bits/raw/master/pokemon.csv")
pokemon.head()
| # | Name | Type 1 | Type 2 | Total | HP | Attack | Defense | Sp. Atk | Sp. Def | Speed | Generation | Legendary | |
|---|---|---|---|---|---|---|---|---|---|---|---|---|---|
| 0 | 1 | Bulbasaur | Grass | Poison | 318 | 45 | 49 | 49 | 65 | 65 | 45 | 1 | False |
| 1 | 2 | Ivysaur | Grass | Poison | 405 | 60 | 62 | 63 | 80 | 80 | 60 | 1 | False |
| 2 | 3 | Venusaur | Grass | Poison | 525 | 80 | 82 | 83 | 100 | 100 | 80 | 1 | False |
| 3 | 3 | VenusaurMega Venusaur | Grass | Poison | 625 | 80 | 100 | 123 | 122 | 120 | 80 | 1 | False |
| 4 | 4 | Charmander | Fire | NaN | 309 | 39 | 52 | 43 | 60 | 50 | 65 | 1 | False |
Writing for loops from scratch#
numbers = [1, 3, 4, 6, 81, 80, 100, 95]
# Your solution here

# Notes on how to write my for loop

# 1. loop over all numbers and print them (`for`)
# 2. write a conditional statement to see if the number is even or odd (`%2==0`)
# 3. write a conditional statement to see if the number is divisible by 5 (`%5 == 0)
# 4. add to `my_list` the appropriate string (`.append`)


# full solution

my_list = []
for i in numbers:
    if i % 5 == 0:  # checks if num is divisible by 5
        if i % 2 == 0:
            my_list.append("five even")
        else:
            my_list.append("five odd")

    elif (i % 2 == 0) and (i % 5 != 0):  # checks if num is even and NOT divisible by 5
        my_list.append("even")

    elif (i % 2 != 0) and (i % 5 != 0):  # checks if num is odd and NOT divisible by 5
        my_list.append("odd")


# point 1

# for i in numbers:
#     print(i)

# point 2

# for i in numbers:
#     if (i%2 == 0):
#         print(i,'even')
#     else:
#         print(i,'odd')

# point 3

# for i in numbers:
#     if (i%5 == 0):
#         print(i,'divisble by 5')
#     else:
#         print(i,'NOT divisble by 5')

# point 4

# my_list = []

# for i in numbers:
#     if (i%5 == 0):
#         my_list.append('divisble by 5')
#     else:
#         my_list.append('NOT divisble by 5')

# my_list
assert my_list == [
    "odd",
    "odd",
    "even",
    "even",
    "odd",
    "five even",
    "five even",
    "five odd",
]
Writing Assert statements#
test = ["1", "2", 3, 4, 5]
ans = [1, 2, 3, 4, 5]

assert test == ans, "Helium baloons fly"  # Left side isn't the same as the right side
---------------------------------------------------------------------------
AssertionError                            Traceback (most recent call last)
Cell In[15], line 4
      1 test = ["1", "2", 3, 4, 5]
      2 ans = [1, 2, 3, 4, 5]
----> 4 assert test == ans, "Helium baloons fly"  # Left side isn't the same as the right side

AssertionError: Helium baloons fly
# method 1
for i, t in enumerate(test):
    test[i] = int(t)

test

assert test == ans, "Failure! Left != Right"
# method 2

assert [int(t) for t in test] == ans, "Failure! Left != Right"
Difference between try/except and assert#
num1 = 5
num2 = 0


def make_larger(n, denominator):
    """Makes the number larger"""

    #assert num2 != 0, "You provided 0 as the denominator - you are a terrible person"
    ret = np.nan
    try:
        ret = n**2 / denominator
    except ZeroDivisionError as e:
        print("You provided 0 as the denominator - you are a terrible person")
        raise e
    finally:
        print("Don't worry, you are the best coder in the history of the coders")
        return ret
make_larger(num1, num2)
---------------------------------------------------------------------------
AssertionError                            Traceback (most recent call last)
Input In [12], in <cell line: 1>()
----> 1 make_larger(num1, num2)

Input In [11], in make_larger(n, denominator)
      5 def make_larger(n, denominator):
      6     """Makes the number larger"""
----> 8     assert num2 != 0, "You provided 0 as the denominator - you are a terrible person"
      9     ret = np.nan
     10     try:

AssertionError: You provided 0 as the denominator - you are a terrible person
Defining functions in a .py folder#
# first, create a .py file (NOT a .ipynb file) to add your functions

# next, import that .py file:

import my_functions as mf

# next, you can now use the functions in the .py file

mf.make_larger2(10, 4)
Method Chaining#
pokemon.head()
pokemon = (
    pokemon.rename(columns={"Type 1": "t1"})
    .rename(columns={"Type 2": "t2"})
    .rename(columns={"Total": "tot"})
)

pokemon.head()
pokemon = pokemon.rename(columns={"Type 1": "t1", "Type 2": "t2", "Total": "tot"})

pokemon.head()
GroupBy vs. Merge#
gb_df = pokemon.groupby("t1").sum()  # .reset_index()[['t1','tot','HP','Attack']]
gb_df
gb_df2 = pokemon.groupby("t1").sum().reset_index()[["t1", "tot", "HP", "Attack"]]
And that’s it!