Task 3: Time Series
Contents
Task 3: Time Series#
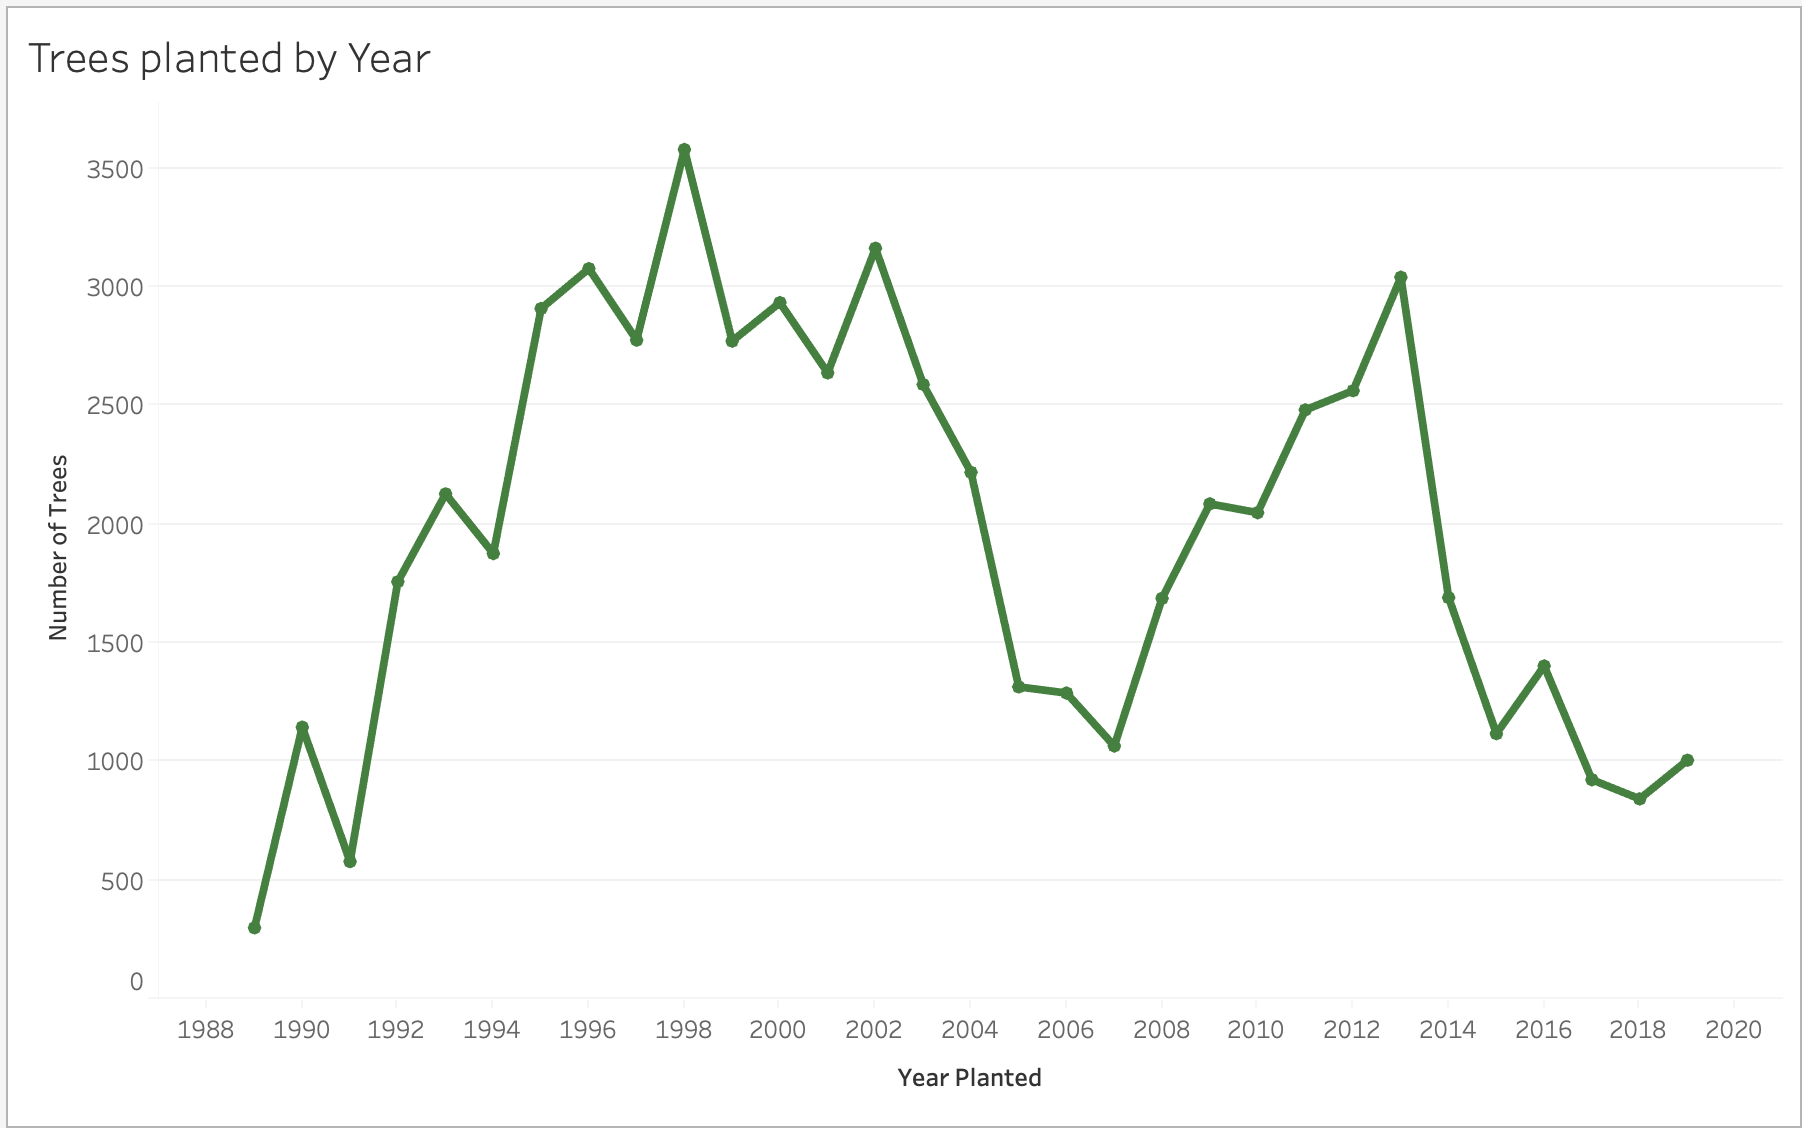
3.1. Trees planted by Year#
Create a new sheet called C1 and plot the number of trees planted and the date they were planted so our two columns of interest are date_plated and tree_id.
Instructions#
Drag the
date_plantedvariable to the “Columns” toolbar and again thetree_idto “Rows”. We are again interested in the amount of trees planted at selected dates so once again we want to transform this to a “Count” type “Measure”.Since `date_planted’ is a continuous variable, it’s a good idea to right-click and transform this into a Continuous Dimension.
This automatically generates the number of trees planted at each year (but there are null values!)
We can change this to:
month - discrete (Top month choice when right-clicking) which aggregates months together for all years
month - continuous (Bottom month choice when right-clicking) which will make a sequential plot.
Combining scatterplot onto our line graph by adding an identical
tree_idto rows and converting it to a counting measurement again. At first, we should get 2 graphs on top of each other. We can right-click one of them and select “Dual Axis”. This will superimpose one on another with a left and a right axis title. We can hide the one on the right by right-clicking the axis and unticking the “Show Header” option.To change the colour of the line and the points, we need to make sure we change the colour of both measures by selecting the “All” tab under the “Marks” card on the right.
Don’t forget to give it a title and edit the y-axis label as we did earlier.
Output#
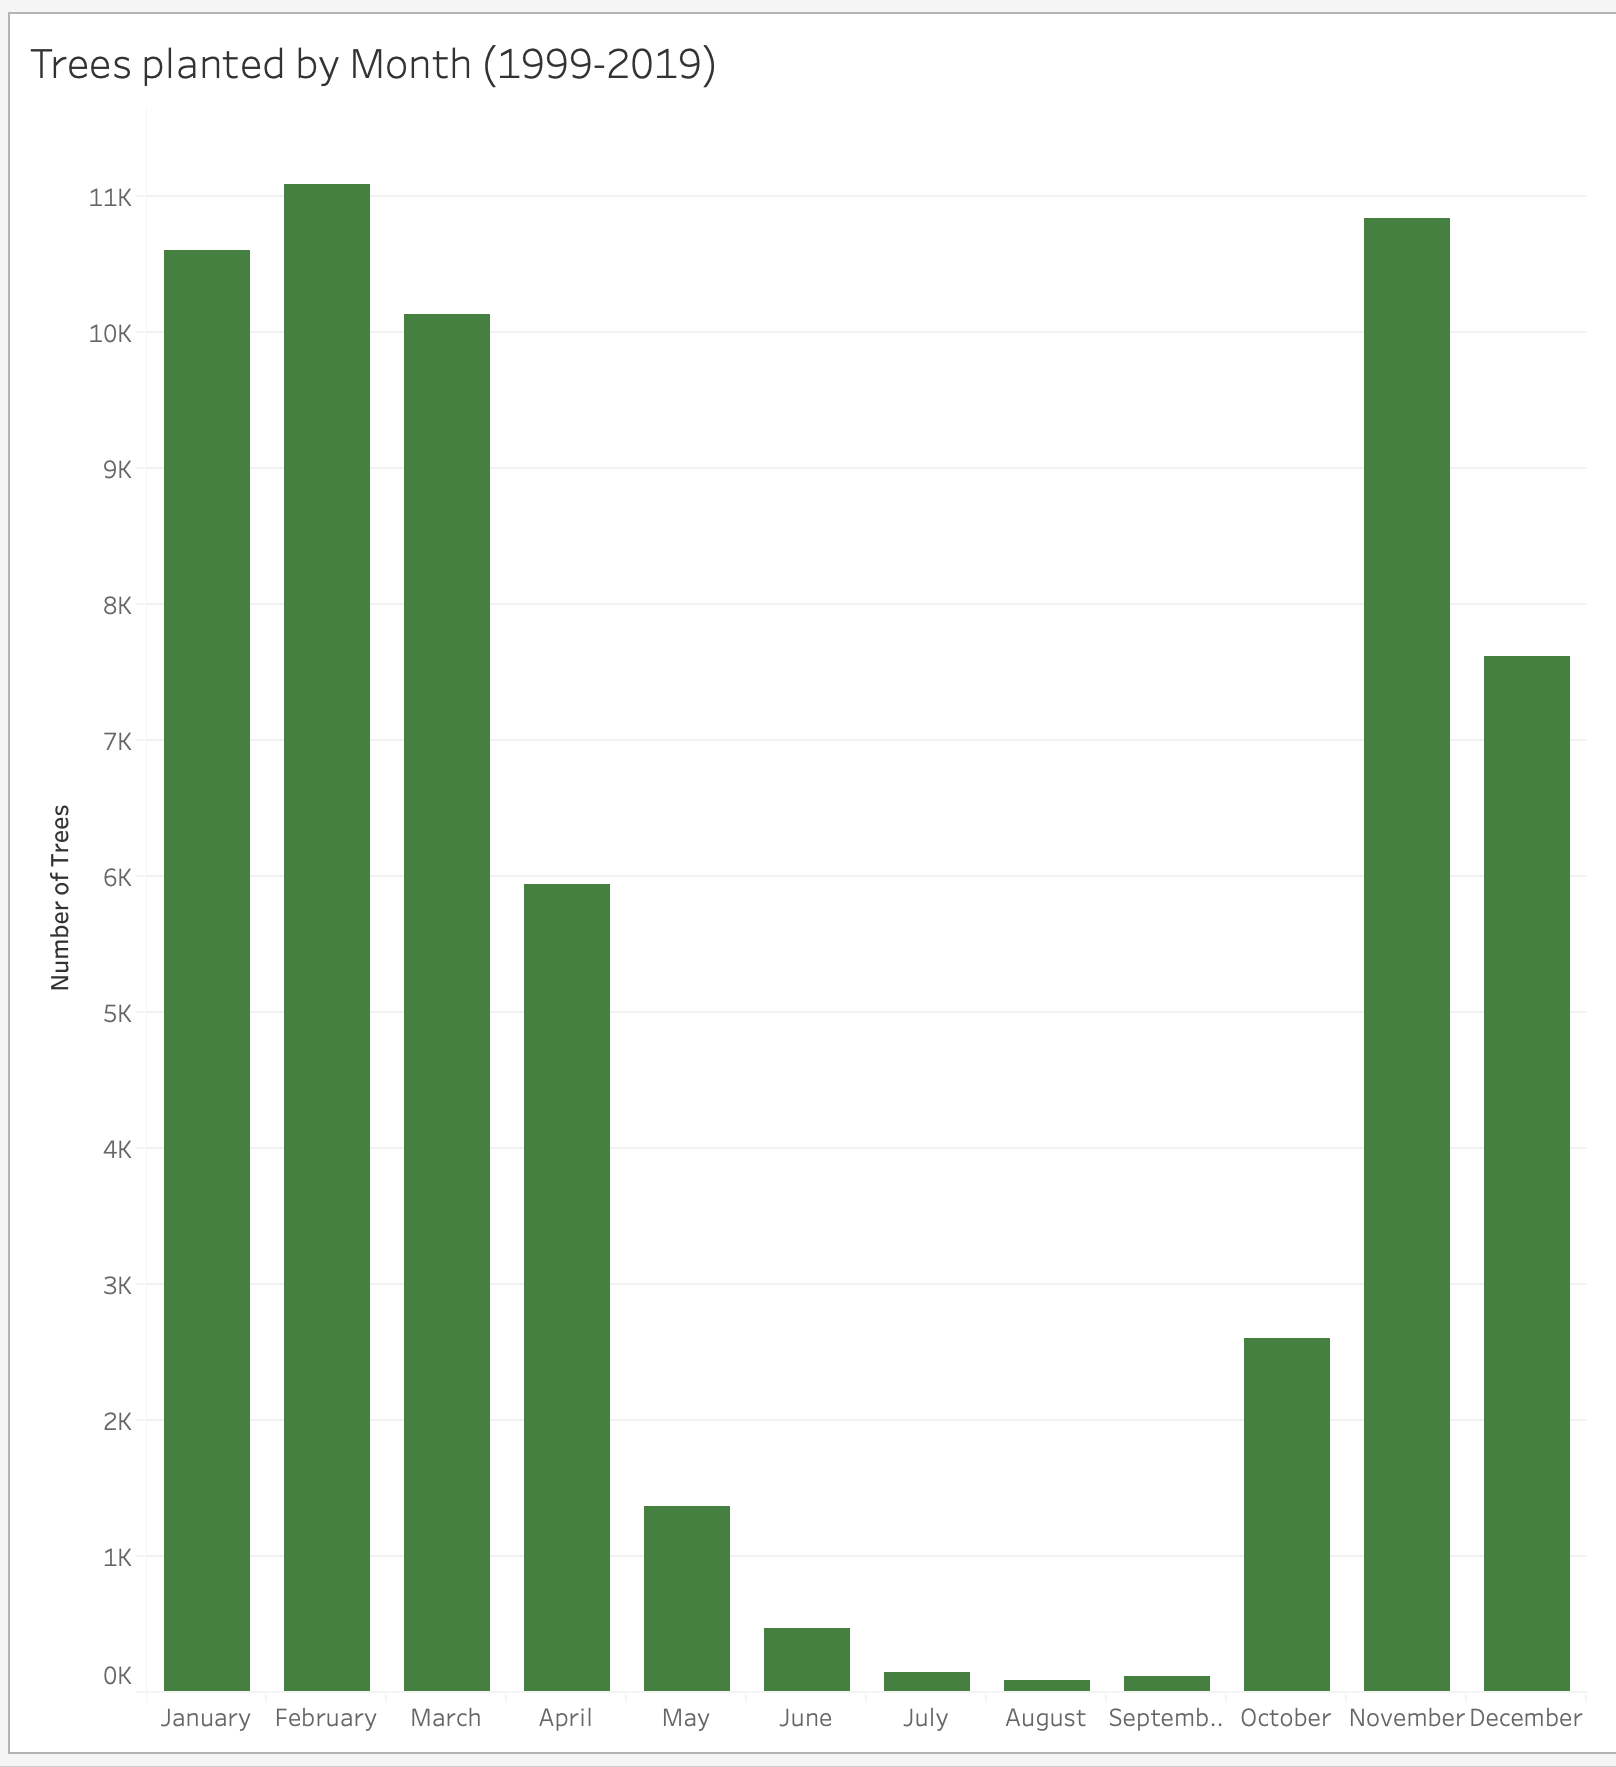
3.2. Trees planted by Month#
Create a new sheet called C2 that has the count of trees planted by month over the years. In other words, across all years, January trees should be reported together.
Add a filter so that the root_barrier is set to N.
Output#