Task 4. Maps (Choropleths)
Contents
Task 4. Maps (Choropleths)#
This, and creating dashboards, is where Tableau really shines!
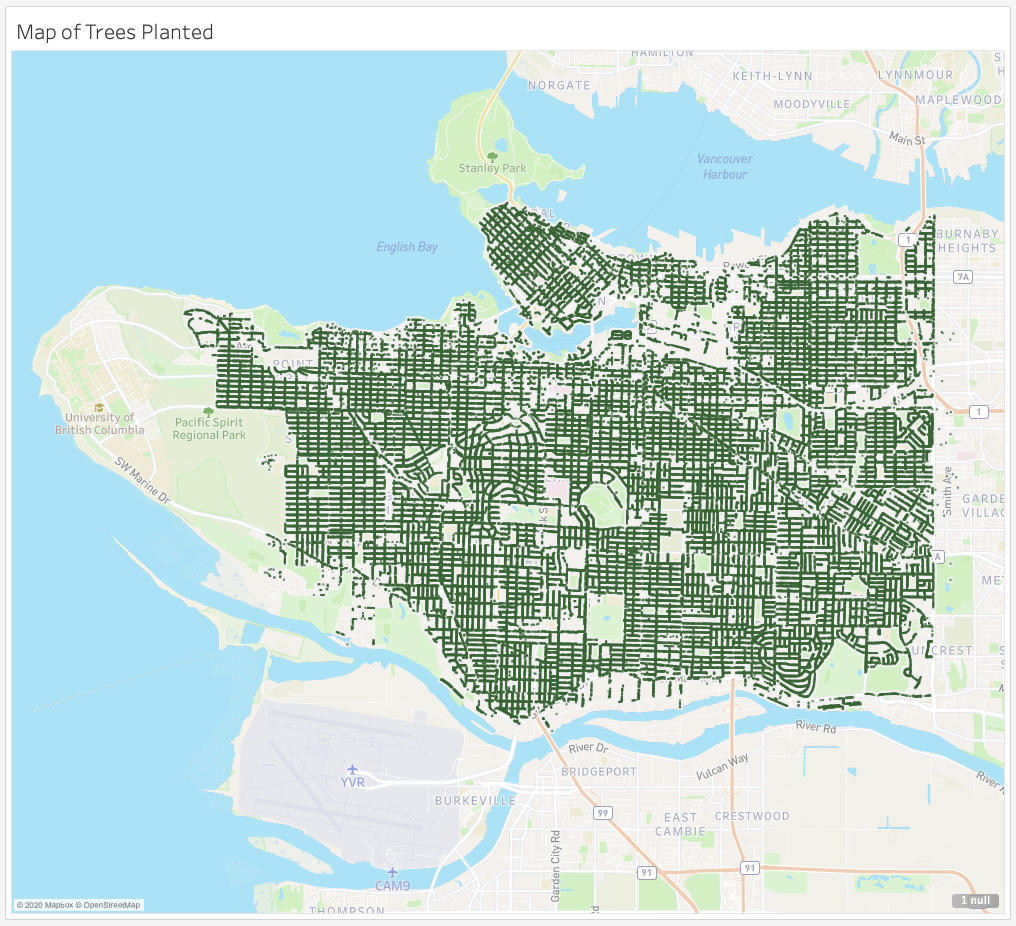
4.1. Map of the trees planted#
Plot the location of the planted trees on a map of Vancouver.
Instructions#
Drag
Longitudeto the “Columns” toolbar.Drag
Latitudeto the “Rows” toolbar.You have essentially made your map but let’s tidy it up.
Decrease the size of your markers by clicking the “Size” icon under the “Marks” card.
Click “Map” on the top toolbar and select “Map Layers…”. This gives you the ability to customize the appearance of your map. You may want to:
Change the map style
Add opacity to the map with “Washout”
Add different Map Layers
Add a title as before and you’ve got a functioning map plot in < 5 mins.
Output#