Task 2
Contents
Task 2#
2.1 - Summary#
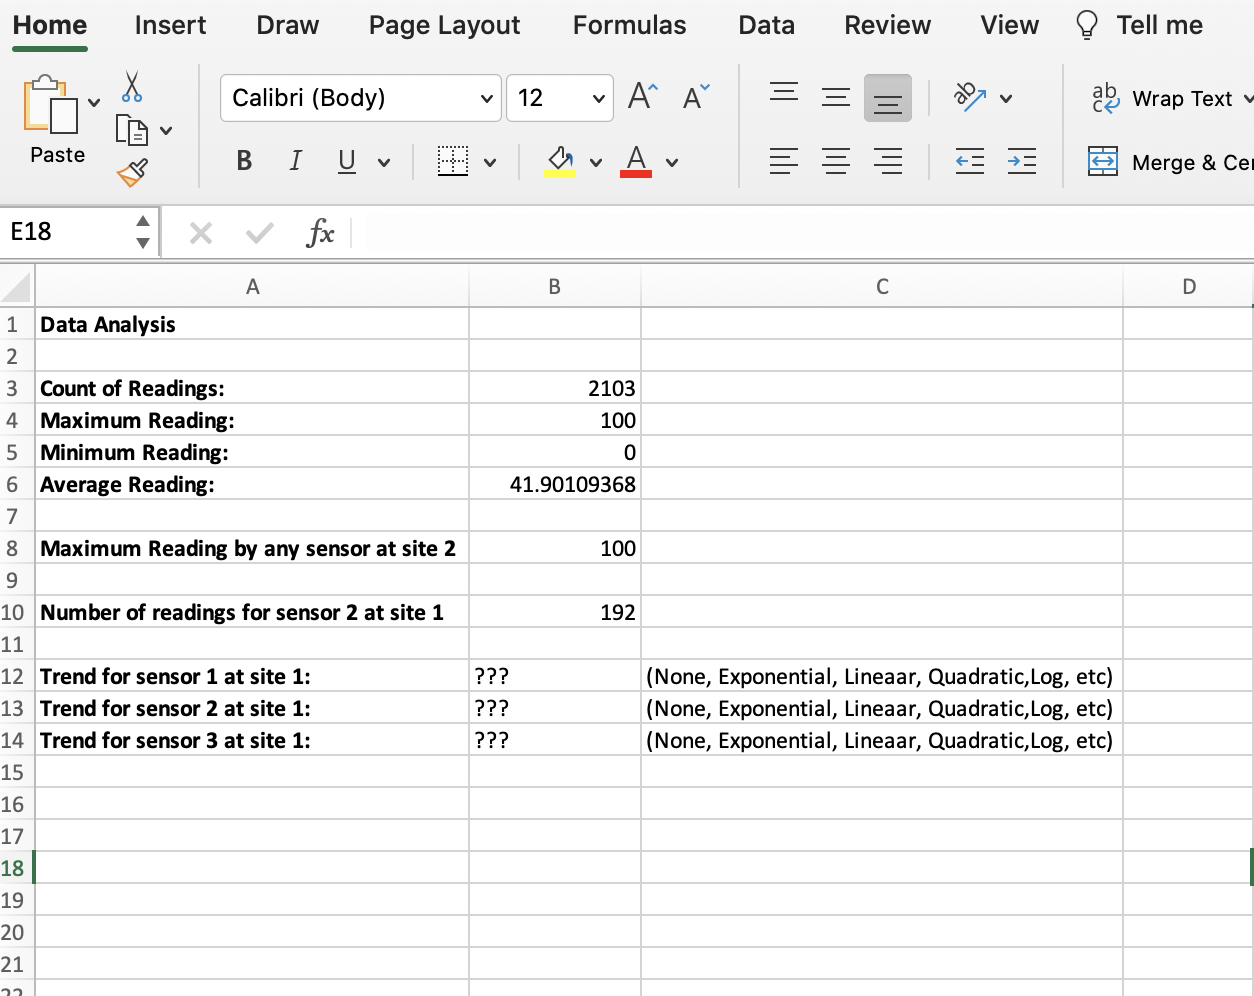
Create a third sheet called summary that contains the following items:
Count of readings in B3
Maximum reading value in B4
Minimum reading value in B5
Average reading in B6
Maximum reading by any sensor at site 2 in B8. Hint: Ctrl+Shift+Enter will be useful. See: Array Output using Ctrl+Shift+Enter
Number of readings for sensor 2 at site 1 in B10. Note: Include all readings including readings that were out of range/errors/blank.
Mention in cell B12 if Sensor 1 at Site 1 has any data trend (none , exponential, linear, etc).
Similarly, in cell B13 mention if Sensor 2 at Site 1 has any data trends
Finaly, in cell B14 mention if Sensor 3 at Site 1 has any data trends
Hint For the data trends look at the appropriate charts and trendlines made in Task 4.
summary sheet#
Your output for the summary sheet should look similar to the screenshot provided below:
SUBMISSION DETAILS:#
Submit ONE Screenshot of the
summarysheet with cell B8 selected so we can see what formula you used in the formula bar.Submit ONE Screenshot of the
summarysheet with cell B10 selected so we can see what formula you used in the formula bar.