Task 1#
1.1 - Loading#
Create an Excel file called lab10.xlsx where the first sheet is called rawdata and contains the orginal loaded dataset with no changes. Follow the following steps for loading the csv file as an excel sheet (rawdata)
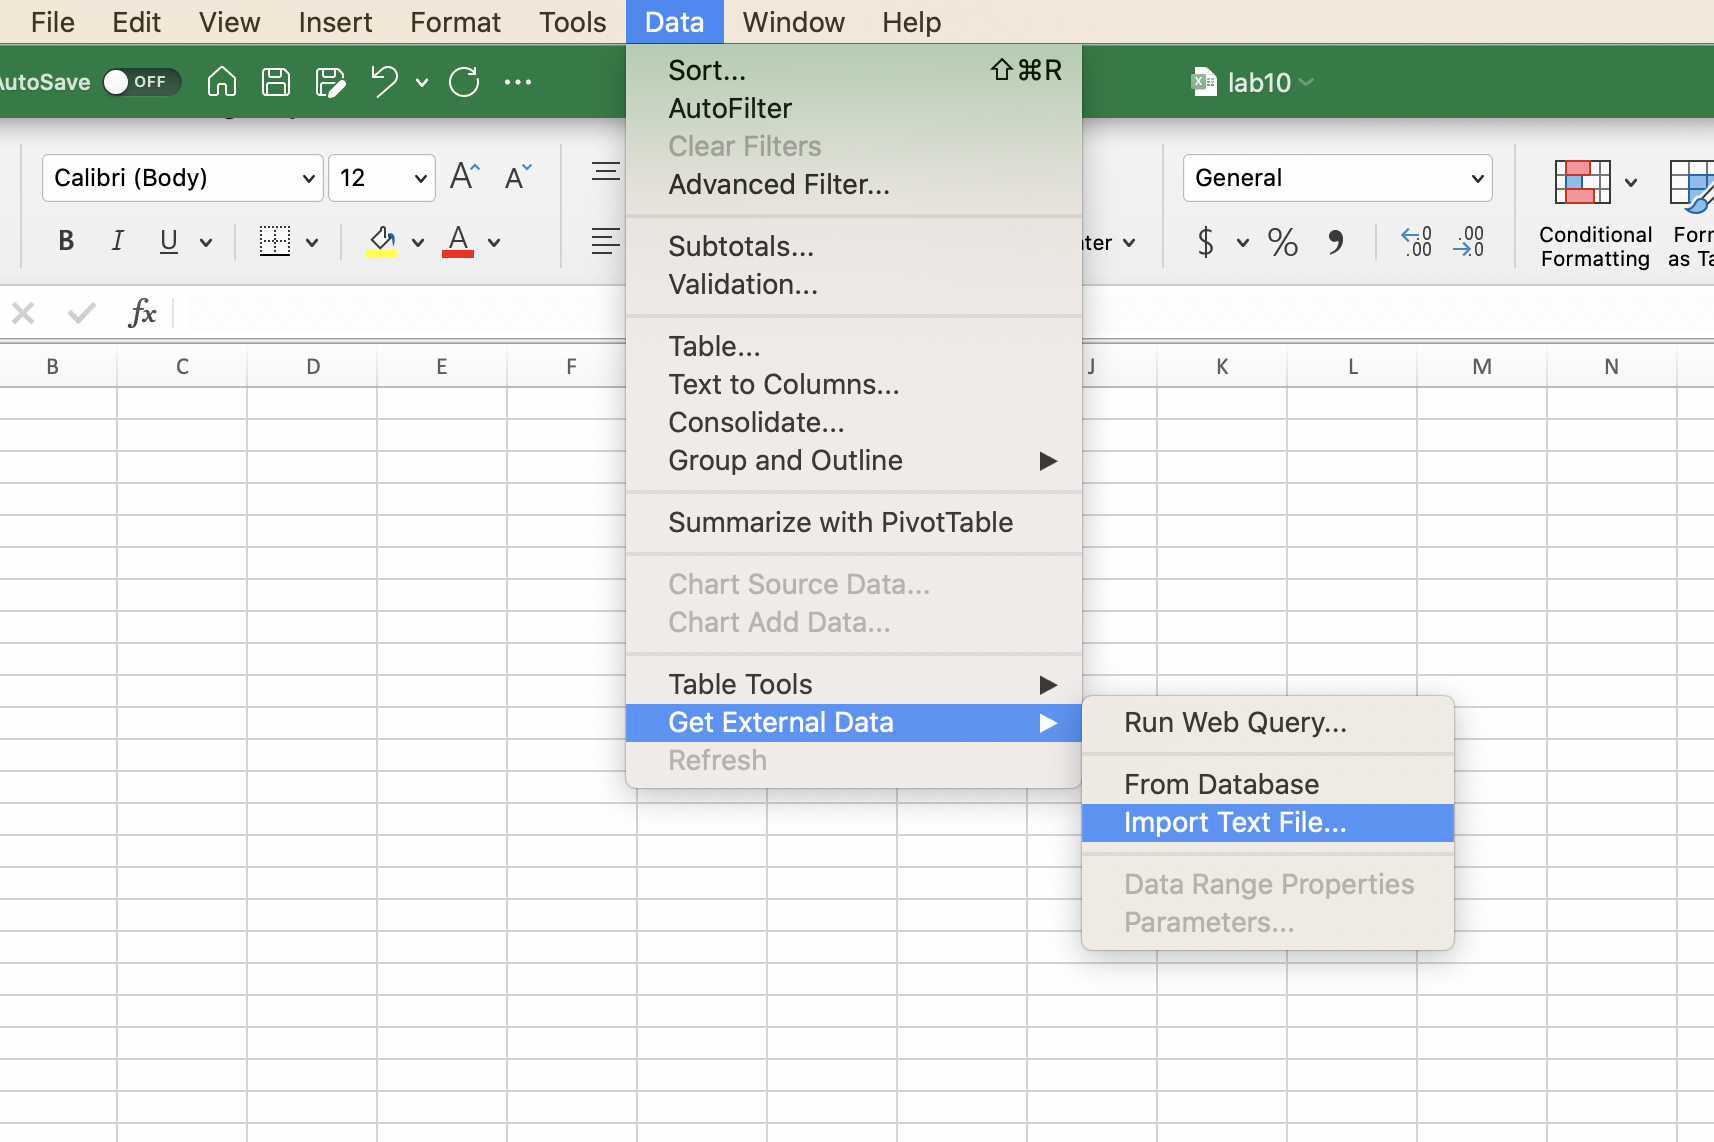
First open a blank workbook, click on Data > Get External Data > Import Text File… (See screenshot for guidance)
Then choose the data.csv file located in the lab 10 directory and click Get Data.
A Text Import Wizard window will pop up where you choose Delimited and then Next >
Choose the delimiter Comma and then click Next >
Choose data format: General and click Finish
Finally, rename sheet to rawdata
loading sheet#

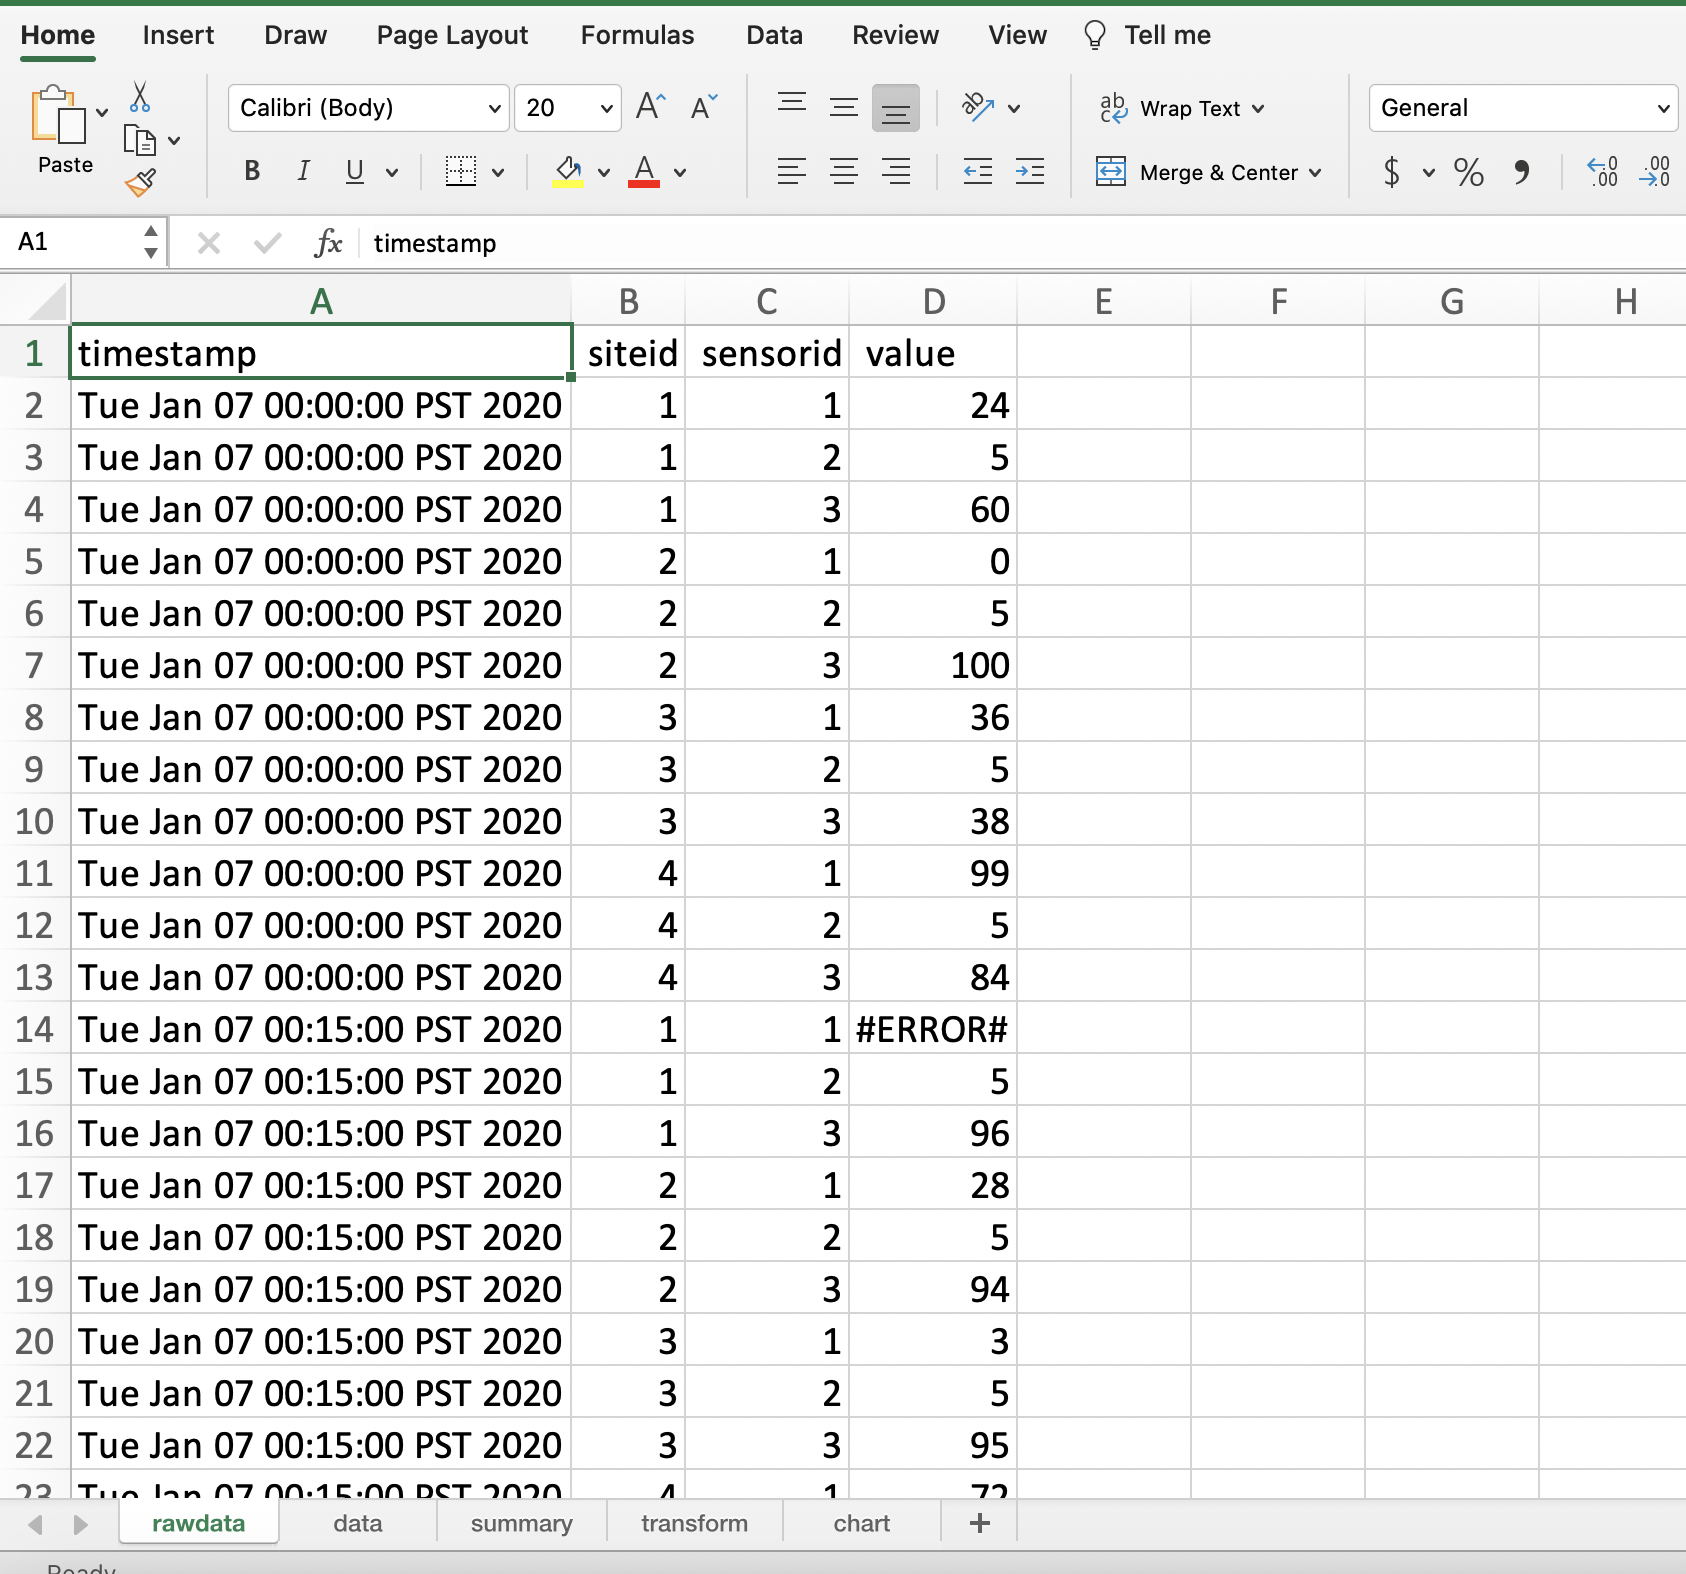
rawdata sheet#
Your output for the rawdata sheet should look similar to the screenshot provided below:

1.2 - Cleaning and Formatting#
Create a second sheet called data that contains the data set after all incorrect and out-of-range values have been removed:
Any data that is not a number (eg. “#ERROR#”, “#NA#”), is less than 0, or above 100 should be replaced by an empty string (“”). Hint: May need to use IF
Header fields must be in bold font.
timestamp field must be formatted as a date field in this format yyyy/mm/dd hh:mm:ss (Use a custom date time format).
Data must be sorted by siteid (ascending), sensorid (ascending), then timestamp (ascending).
Add a column called global_sensor_id that is generated by siteid&”_”&sensorid (for e.g. if siteid = 3 and sensor_id = 1, then global_sensor_id should be 3_1)
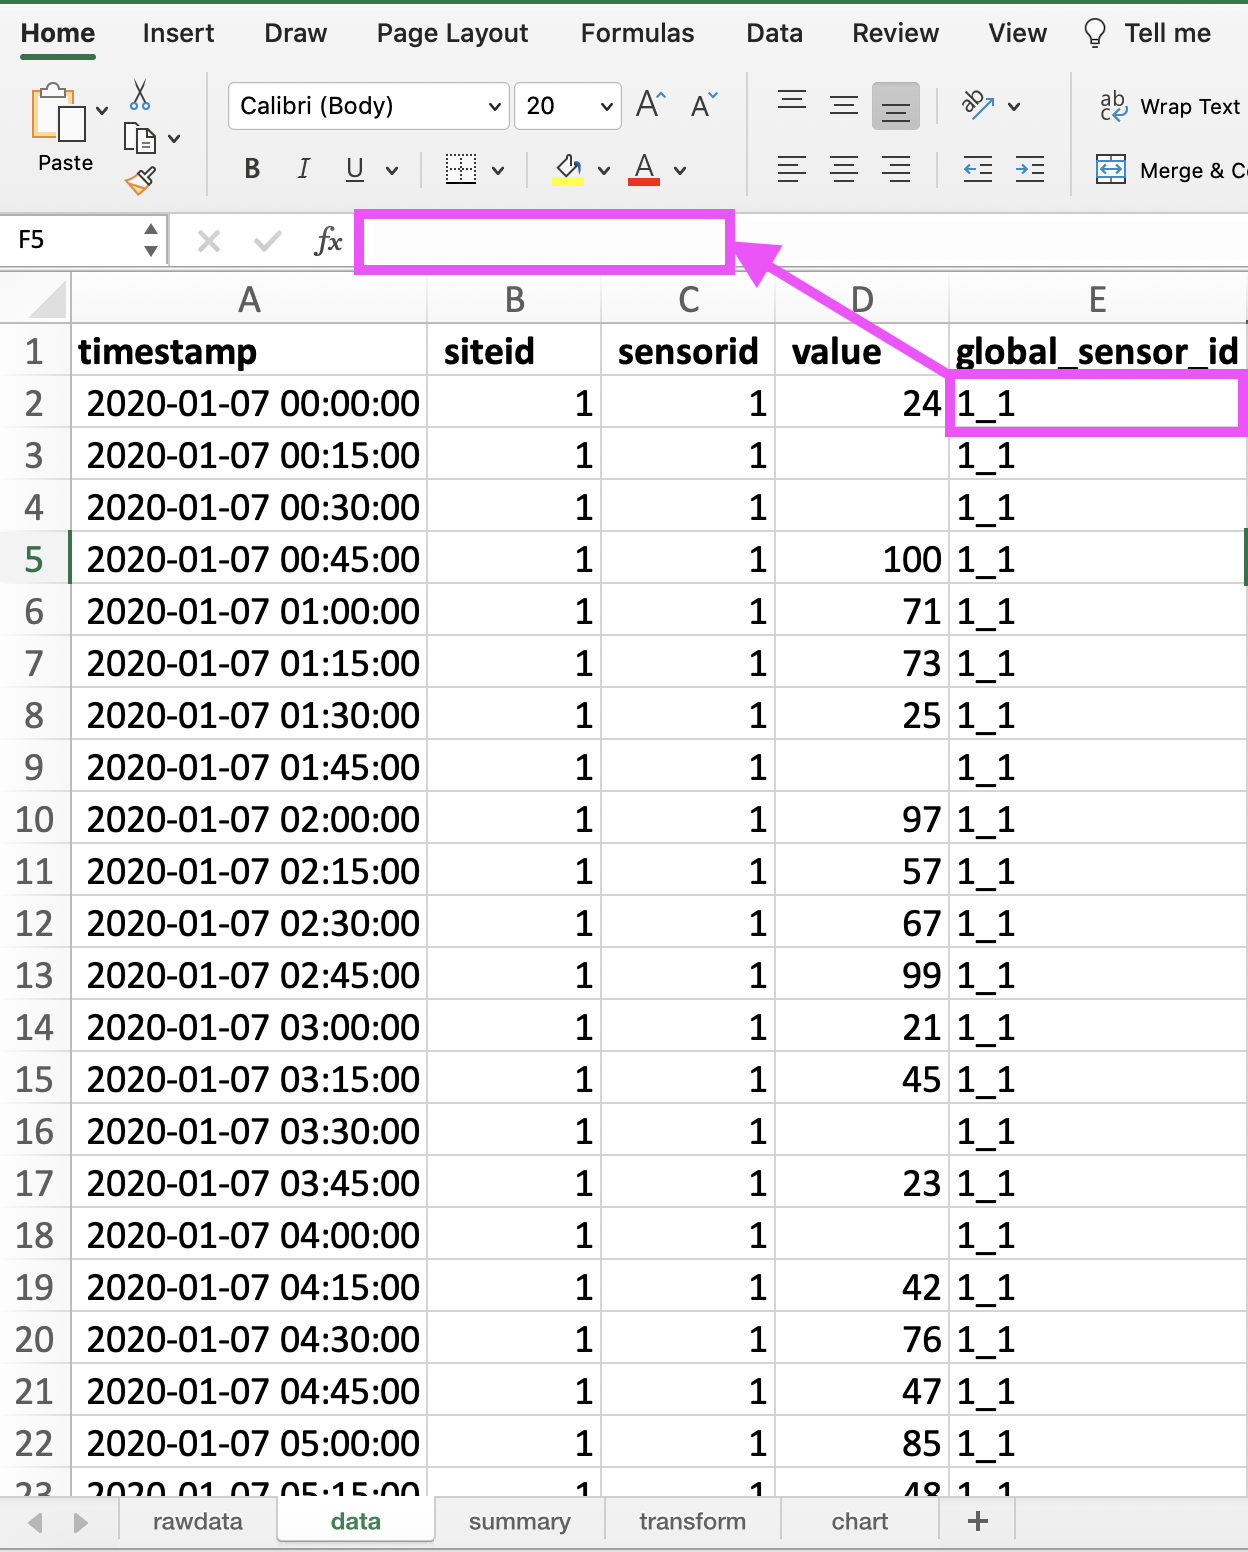
Task 1 data sheet#
Your final output for the data sheet should look similar to the screenshot provided below:

SUBMISSION DETAILS:#
Submit ONE Screenshot of the
datasheet with cell D2 selected so we can see what formula you used in the formula barSubmit ONE Screenshot of the
datasheet with cell E2 selected so we can see what formula you used in the formula bar
