Task 2: EDA and Visualizations#
import pandas as pd
import numpy as np
import matplotlib.pyplot as plt
import seaborn as sns
Seaborn Configuration#
Please use the code from Task 1 in the cell below to configure Seaborn and set your preferred theme.
# Your Solution Here
Load Dataset from Lab 05 Task 1#
In last week’s lab, you worked on the pokemon dataset and added a column to the dataset, and then saved it to a csv file.
Since we would like to re-use that dataset, use a relative path to import the CSV file from Lab 5 (something like: ../lab05-demoFiras/data/filename.csv) we saved in Task 1 of Lab 5.
# Your Solution here
Task 2: Exploratory Data Analysis through Visualization#
2.1. Data Analysis and Visualizations#
2.1.1. Sample Research Question: Which Pokemon Types are the best, as determined by the Weighted Score?#
Important: When referring to Type of the pokemon, please use just the “Type 1” Column.
To answer this question, we will first need to do wrangle the data to return the mean Weighted_Score, split by the Pokemon Type 1.
Here is the goal of this analysis:
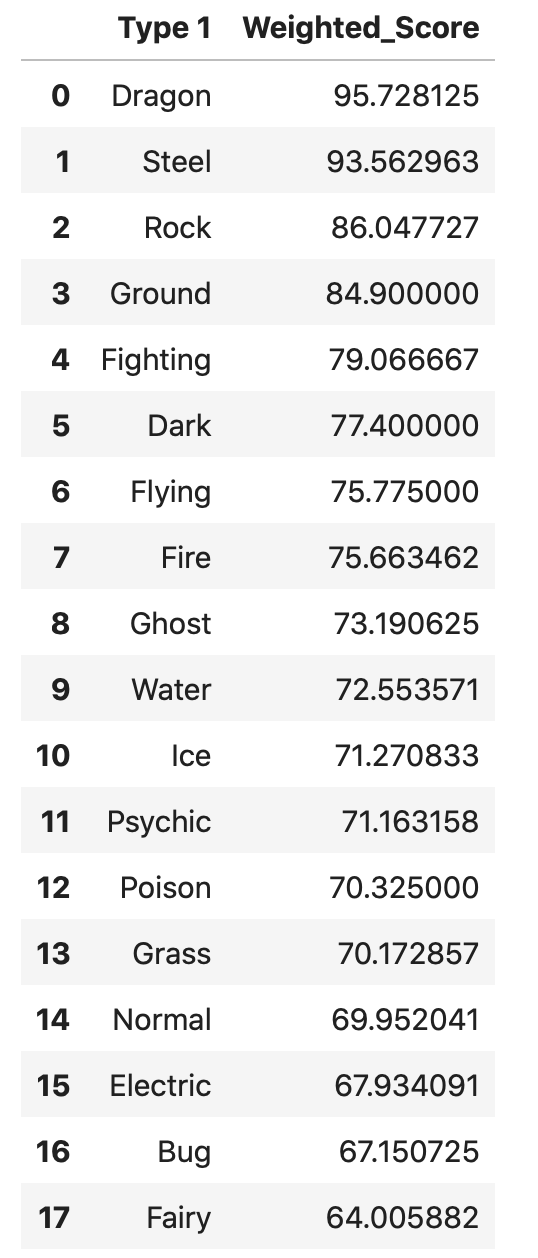
The order of Types does not matter, but the values of the weighted scores must match the sample output above.
# Your Solution here
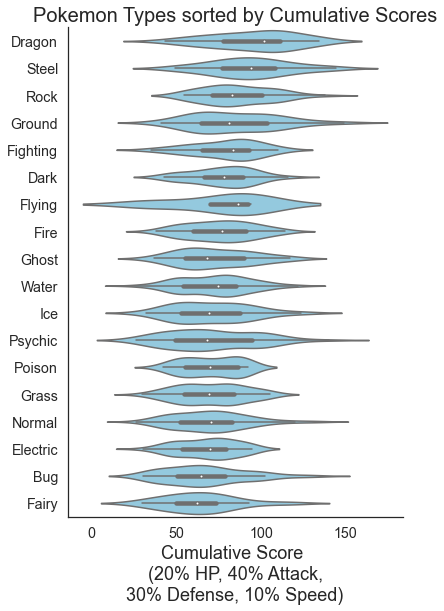
2.1.2. Create a violin plot to show the distribution of Weighted_Scores split by all the Pokémon types (Type 1).#
Here is the goal:
# Your Solution here
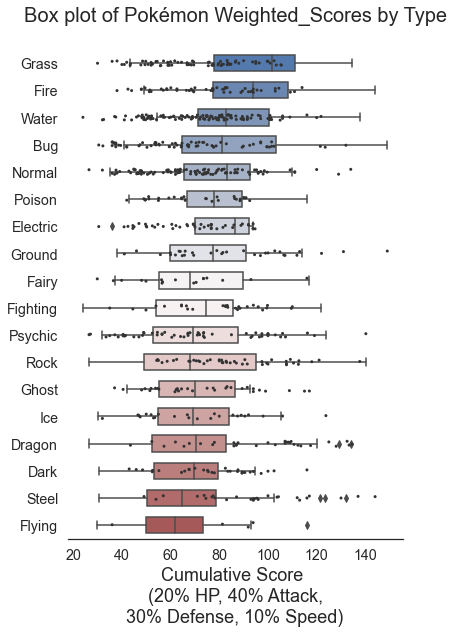
2.1.3. Create a Box Plot and overlay a strip plot#
Please use the Type 1 column.
Here is the goal:
# Your Solution here
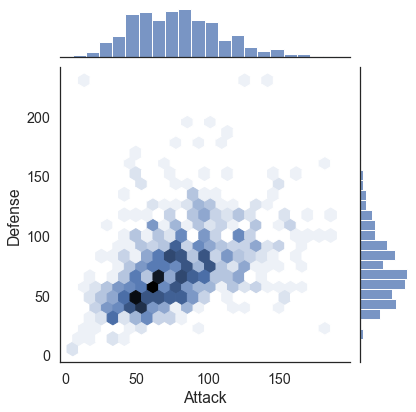
2.1.4. Create a Hexbin plot with marginal distributions#
This plot helps you visualize large amounts of data (and its distributions) by using colours to represent the number of points in a hexagonal shape.
Here is the goal:
# Your Solution here
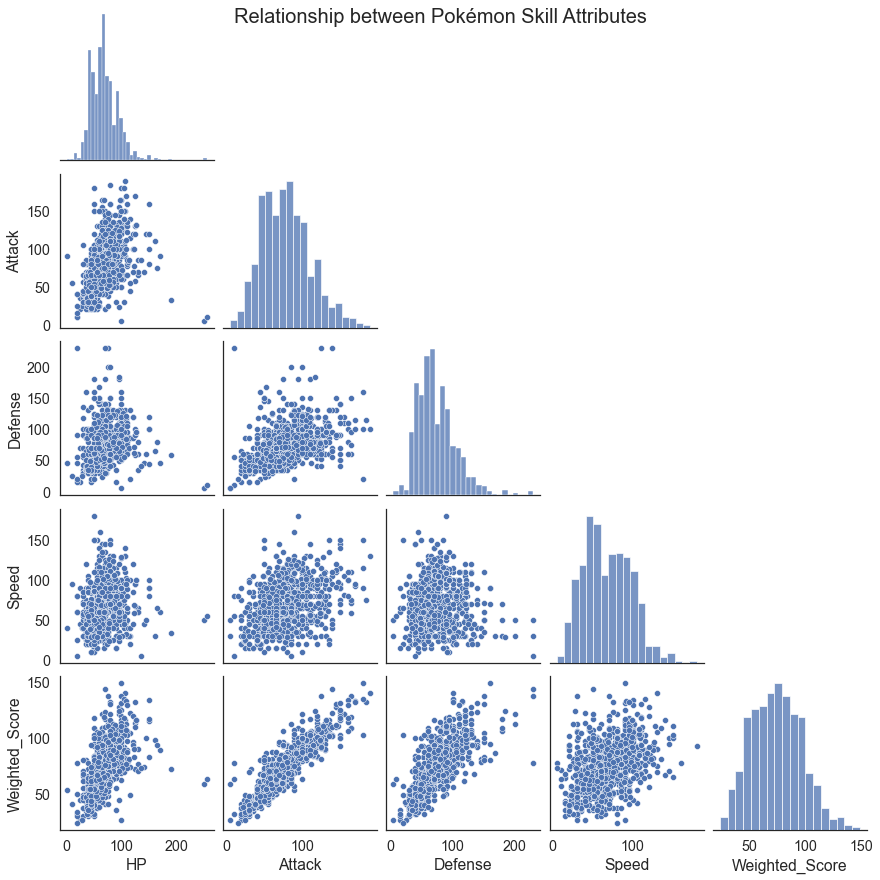
2.1.5. Create a PairPlot of the quantiative features of the pokémon dataset#
Here is the goal:
# Your Solution here
2.2. Summary and conclusions#
2.2.1. Summarize your findings and describe any conclusions and insight you were able to draw from your visualizations.#
Sample Research Question: Which Pokemon Types are the best, as determined by the Weighted Score?
Summary of findings, insight, and conclusions
..
Research Question 1: RQ here
Summary of findings, insight, and conclusions
..
Research Question 2: RQ here
Summary of findings, insight, and conclusions
..
Notes: There should be some substantial comments and insight in this section. Take it seriously!
# Your Solution Here