Practicing EDA#
import pandas as pd
import seaborn as sns
import numpy as np
import matplotlib.pyplot as plt

sns.set_theme(style="white", font_scale=1.4)
df = pd.read_csv("https://github.com/firasm/bits/raw/master/bullet_data.csv")
df.head()
| x | y | bullet | zone | |
|---|---|---|---|---|
| 0 | 0 | 0 | 0.0 | OutsidePlane |
| 1 | 0 | 1 | 0.0 | OutsidePlane |
| 2 | 0 | 2 | 0.0 | OutsidePlane |
| 3 | 0 | 3 | 0.0 | OutsidePlane |
| 4 | 0 | 4 | 0.0 | OutsidePlane |
df.describe().T
| count | mean | std | min | 25% | 50% | 75% | max | |
|---|---|---|---|---|---|---|---|---|
| x | 87500.0 | 124.500000 | 72.168619 | 0.0 | 62.0 | 124.5 | 187.0 | 249.0 |
| y | 87500.0 | 174.500000 | 101.036462 | 0.0 | 87.0 | 174.5 | 262.0 | 349.0 |
| bullet | 68526.0 | 0.008741 | 0.093086 | 0.0 | 0.0 | 0.0 | 0.0 | 1.0 |
print(f"The possible values for zone are:\n {sorted(list(df['zone'].unique()))} ")
The possible values for zone are:
 ['A', 'B', 'C', 'D', 'E', 'OutsidePlane', 'Unknown']
print(f"The possible columns are: {list(df.columns)}")
The possible columns are: ['x', 'y', 'bullet', 'zone']
print(f"The possible values for bullets are: \n {df['bullet'].unique()}")
The possible values for bullets are:
 [ 0. nan  1.]
len(df[df['bullet']==1])
599
df['bullet']==1
0        False
1        False
2        False
3        False
4        False
         ...
87495    False
87496    False
87497    False
87498    False
87499    False
Name: bullet, Length: 87500, dtype: bool
hits_df = df[df['bullet']==1]
hits_df.head()
| x | y | bullet | zone | |
|---|---|---|---|---|
| 24303 | 69 | 153 | 1.0 | B |
| 24308 | 69 | 158 | 1.0 | B |
| 24341 | 69 | 191 | 1.0 | B |
| 24629 | 70 | 129 | 1.0 | B |
| 24636 | 70 | 136 | 1.0 | B |
hits_df['zone'].unique()
array(['B', 'C', 'A', 'Unknown', 'D', 'E'], dtype=object)
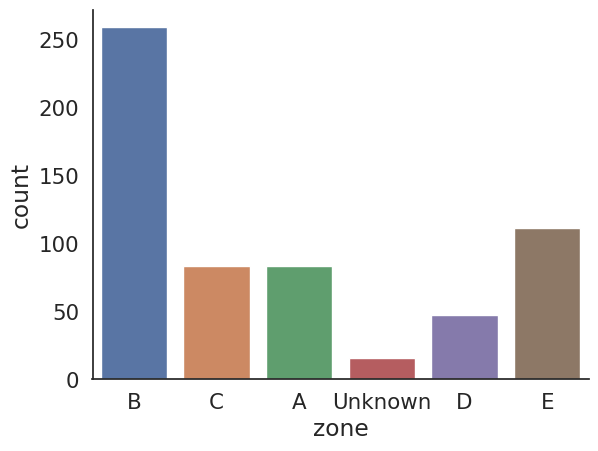
hits_df.groupby('zone').count()
| x | y | bullet | |
|---|---|---|---|
| zone | |||
| A | 83 | 83 | 83 |
| B | 259 | 259 | 259 |
| C | 83 | 83 | 83 |
| D | 47 | 47 | 47 |
| E | 111 | 111 | 111 |
| Unknown | 16 | 16 | 16 |
sns.countplot(data=hits_df, x= "zone")
sns.despine()
#plt.title("Bullet hit count by Airplane Zone")
#plt.xlabel("Bullet hits")

df["outline"] = np.where(df["zone"]== "OutsidePlane",0,1)
df
| x | y | bullet | zone | outline | |
|---|---|---|---|---|---|
| 0 | 0 | 0 | 0.0 | OutsidePlane | 0 |
| 1 | 0 | 1 | 0.0 | OutsidePlane | 0 |
| 2 | 0 | 2 | 0.0 | OutsidePlane | 0 |
| 3 | 0 | 3 | 0.0 | OutsidePlane | 0 |
| 4 | 0 | 4 | 0.0 | OutsidePlane | 0 |
| ... | ... | ... | ... | ... | ... |
| 87495 | 249 | 345 | 0.0 | OutsidePlane | 0 |
| 87496 | 249 | 346 | 0.0 | OutsidePlane | 0 |
| 87497 | 249 | 347 | 0.0 | OutsidePlane | 0 |
| 87498 | 249 | 348 | 0.0 | OutsidePlane | 0 |
| 87499 | 249 | 349 | 0.0 | OutsidePlane | 0 |
87500 rows × 5 columns
df.pivot("x","y","outline")
---------------------------------------------------------------------------
TypeError                                 Traceback (most recent call last)
Cell In[14], line 1
----> 1 df.pivot("x","y","outline")

TypeError: DataFrame.pivot() takes 1 positional argument but 4 were given
ax = sns.heatmap(data=df.pivot("x","y","outline"))
ax.set(xlabel=None)
ax.set(ylabel=None)
plt.axis('off')
(0.0, 350.0, 250.0, 0.0)

ax = sns.heatmap(data=df.pivot("x","y","bullet"),
                 cmap="Spectral")
ax.set(xlabel=None)
ax.set(ylabel=None)
plt.axis('off')
(0.0, 350.0, 250.0, 0.0)


