Practicing Exploratory Data Analysis#
import pandas as pd
import numpy as np
# visualization related imports and configurations: Seaborn, matplotlib, seaborn themes
import seaborn as sns
import matplotlib.pyplot as plt

sns.set_theme(style="whitegrid", font_scale=2)
Case Study: Planes in WW2#
You have been given a dataset and tasked with trying to solve a problem. In WW2, expensive fighter planes were going down quite frequently due to bullet fire. The military decided to conduct an analysis and surveyed all the surviving planes in an effort to catalogue which regions of the plane should be reinforced.
With limited resources, the military could only reinforce a maximum of two zones. Your task is to look at the bullet data for the planes and help determine which areas of the plane should be reinforced.
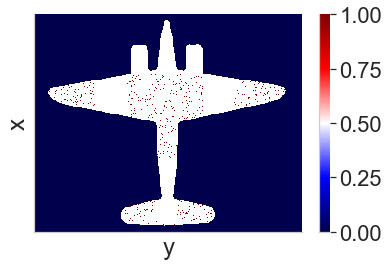
You’re given a schematic of the plane, and told that the workers added a grid to the schematic, divided it up into regions A,B,C,D,E and recorded a value of 1 wherever there was a bullet hole across all the planes that returned. Areas without bullet holes are marked as 0.
They gave you a csv file with this information called bullet_data.csv. Yes, these WW2 workers are very sophisticated and had access to a computer :-).

Load Data#
df = pd.read_csv("https://github.com/firasm/bits/raw/master/bullet_data.csv")
df.head()
| x | y | bullet | zone | |
|---|---|---|---|---|
| 0 | 0 | 0 | 0.0 | OutsidePlane |
| 1 | 0 | 1 | 0.0 | OutsidePlane |
| 2 | 0 | 2 | 0.0 | OutsidePlane |
| 3 | 0 | 3 | 0.0 | OutsidePlane |
| 4 | 0 | 4 | 0.0 | OutsidePlane |
df["x"].max(), df["y"].max()
(249, 349)
df["x"].min(), df["y"].min()
(0, 0)
df["bullet"].unique()
array([ 0., nan, 1.])
df.describe()
| x | y | bullet | |
|---|---|---|---|
| count | 87500.000000 | 87500.000000 | 68526.000000 |
| mean | 124.500000 | 174.500000 | 0.008741 |
| std | 72.168619 | 101.036462 | 0.093086 |
| min | 0.000000 | 0.000000 | 0.000000 |
| 25% | 62.000000 | 87.000000 | 0.000000 |
| 50% | 124.500000 | 174.500000 | 0.000000 |
| 75% | 187.000000 | 262.000000 | 0.000000 |
| max | 249.000000 | 349.000000 | 1.000000 |
sorted(df["zone"].unique().tolist())
['A', 'B', 'C', 'D', 'E', 'OutsidePlane', 'Unknown']
Imagining the final dataframe#
Zone |
Sum of total bullet hits |
|---|---|
A |
|
B |
|
C |
|
D |
|
E |
|
Outside Plane |
|
NA |
df[df["bullet"] == 1]
| x | y | bullet | zone | |
|---|---|---|---|---|
| 24303 | 69 | 153 | 1.0 | B |
| 24308 | 69 | 158 | 1.0 | B |
| 24341 | 69 | 191 | 1.0 | B |
| 24629 | 70 | 129 | 1.0 | B |
| 24636 | 70 | 136 | 1.0 | B |
| ... | ... | ... | ... | ... |
| 83874 | 239 | 224 | 1.0 | E |
| 84149 | 240 | 149 | 1.0 | E |
| 84487 | 241 | 137 | 1.0 | Unknown |
| 84518 | 241 | 168 | 1.0 | Unknown |
| 84533 | 241 | 183 | 1.0 | Unknown |
599 rows × 4 columns
hits_df = df[df["bullet"] == 1]
hits_df
| x | y | bullet | zone | |
|---|---|---|---|---|
| 24303 | 69 | 153 | 1.0 | B |
| 24308 | 69 | 158 | 1.0 | B |
| 24341 | 69 | 191 | 1.0 | B |
| 24629 | 70 | 129 | 1.0 | B |
| 24636 | 70 | 136 | 1.0 | B |
| ... | ... | ... | ... | ... |
| 83874 | 239 | 224 | 1.0 | E |
| 84149 | 240 | 149 | 1.0 | E |
| 84487 | 241 | 137 | 1.0 | Unknown |
| 84518 | 241 | 168 | 1.0 | Unknown |
| 84533 | 241 | 183 | 1.0 | Unknown |
599 rows × 4 columns
hits_df_gb = hits_df.groupby("zone").sum().reset_index()
hits_df_gb
| zone | x | y | bullet | |
|---|---|---|---|---|
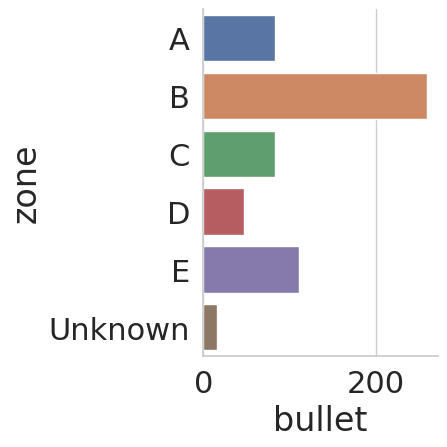
| 0 | A | 7627 | 4638 | 83.0 |
| 1 | B | 24501 | 44167 | 259.0 |
| 2 | C | 7533 | 24025 | 83.0 |
| 3 | D | 6613 | 8223 | 47.0 |
| 4 | E | 25247 | 19938 | 111.0 |
| 5 | Unknown | 2520 | 2586 | 16.0 |
hits_df_gb["bullet"].sum()
599.0
sns.catplot(data=hits_df_gb, y="zone", x="bullet", kind="bar")
<seaborn.axisgrid.FacetGrid at 0x7f3e30b044f0>

sns.heatmap(data=df, x="x", y="y")
---------------------------------------------------------------------------
ValueError                                Traceback (most recent call last)
Cell In[14], line 1
----> 1 sns.heatmap(data=df, x="x", y="y")

File /opt/hostedtoolcache/Python/3.10.13/x64/lib/python3.10/site-packages/seaborn/matrix.py:446, in heatmap(data, vmin, vmax, cmap, center, robust, annot, fmt, annot_kws, linewidths, linecolor, cbar, cbar_kws, cbar_ax, square, xticklabels, yticklabels, mask, ax, **kwargs)
    365 """Plot rectangular data as a color-encoded matrix.
    366
    367 This is an Axes-level function and will draw the heatmap into the
   (...)
    443
    444 """
    445 # Initialize the plotter object
--> 446 plotter = _HeatMapper(data, vmin, vmax, cmap, center, robust, annot, fmt,
    447                       annot_kws, cbar, cbar_kws, xticklabels,
    448                       yticklabels, mask)
    450 # Add the pcolormesh kwargs here
    451 kwargs["linewidths"] = linewidths

File /opt/hostedtoolcache/Python/3.10.13/x64/lib/python3.10/site-packages/seaborn/matrix.py:163, in _HeatMapper.__init__(self, data, vmin, vmax, cmap, center, robust, annot, fmt, annot_kws, cbar, cbar_kws, xticklabels, yticklabels, mask)
    160 self.ylabel = ylabel if ylabel is not None else ""
    162 # Determine good default values for the colormapping
--> 163 self._determine_cmap_params(plot_data, vmin, vmax,
    164                             cmap, center, robust)
    166 # Sort out the annotations
    167 if annot is None or annot is False:

File /opt/hostedtoolcache/Python/3.10.13/x64/lib/python3.10/site-packages/seaborn/matrix.py:197, in _HeatMapper._determine_cmap_params(self, plot_data, vmin, vmax, cmap, center, robust)
    194 """Use some heuristics to set good defaults for colorbar and range."""
    196 # plot_data is a np.ma.array instance
--> 197 calc_data = plot_data.astype(float).filled(np.nan)
    198 if vmin is None:
    199     if robust:

ValueError: could not convert string to float: 'OutsidePlane'
df_heatmap = df.pivot(index="x", columns="y", values="bullet")
df_heatmap
| y | 0 | 1 | 2 | 3 | 4 | 5 | 6 | 7 | 8 | 9 | ... | 340 | 341 | 342 | 343 | 344 | 345 | 346 | 347 | 348 | 349 |
|---|---|---|---|---|---|---|---|---|---|---|---|---|---|---|---|---|---|---|---|---|---|
| x | |||||||||||||||||||||
| 0 | 0.0 | 0.0 | 0.0 | 0.0 | 0.0 | 0.0 | 0.0 | 0.0 | 0.0 | 0.0 | ... | 0.0 | 0.0 | 0.0 | 0.0 | 0.0 | 0.0 | 0.0 | 0.0 | 0.0 | 0.0 |
| 1 | 0.0 | 0.0 | 0.0 | 0.0 | 0.0 | 0.0 | 0.0 | 0.0 | 0.0 | 0.0 | ... | 0.0 | 0.0 | 0.0 | 0.0 | 0.0 | 0.0 | 0.0 | 0.0 | 0.0 | 0.0 |
| 2 | 0.0 | 0.0 | 0.0 | 0.0 | 0.0 | 0.0 | 0.0 | 0.0 | 0.0 | 0.0 | ... | 0.0 | 0.0 | 0.0 | 0.0 | 0.0 | 0.0 | 0.0 | 0.0 | 0.0 | 0.0 |
| 3 | 0.0 | 0.0 | 0.0 | 0.0 | 0.0 | 0.0 | 0.0 | 0.0 | 0.0 | 0.0 | ... | 0.0 | 0.0 | 0.0 | 0.0 | 0.0 | 0.0 | 0.0 | 0.0 | 0.0 | 0.0 |
| 4 | 0.0 | 0.0 | 0.0 | 0.0 | 0.0 | 0.0 | 0.0 | 0.0 | 0.0 | 0.0 | ... | 0.0 | 0.0 | 0.0 | 0.0 | 0.0 | 0.0 | 0.0 | 0.0 | 0.0 | 0.0 |
| ... | ... | ... | ... | ... | ... | ... | ... | ... | ... | ... | ... | ... | ... | ... | ... | ... | ... | ... | ... | ... | ... |
| 245 | 0.0 | 0.0 | 0.0 | 0.0 | 0.0 | 0.0 | 0.0 | 0.0 | 0.0 | 0.0 | ... | 0.0 | 0.0 | 0.0 | 0.0 | 0.0 | 0.0 | 0.0 | 0.0 | 0.0 | 0.0 |
| 246 | 0.0 | 0.0 | 0.0 | 0.0 | 0.0 | 0.0 | 0.0 | 0.0 | 0.0 | 0.0 | ... | 0.0 | 0.0 | 0.0 | 0.0 | 0.0 | 0.0 | 0.0 | 0.0 | 0.0 | 0.0 |
| 247 | 0.0 | 0.0 | 0.0 | 0.0 | 0.0 | 0.0 | 0.0 | 0.0 | 0.0 | 0.0 | ... | 0.0 | 0.0 | 0.0 | 0.0 | 0.0 | 0.0 | 0.0 | 0.0 | 0.0 | 0.0 |
| 248 | 0.0 | 0.0 | 0.0 | 0.0 | 0.0 | 0.0 | 0.0 | 0.0 | 0.0 | 0.0 | ... | 0.0 | 0.0 | 0.0 | 0.0 | 0.0 | 0.0 | 0.0 | 0.0 | 0.0 | 0.0 |
| 249 | 0.0 | 0.0 | 0.0 | 0.0 | 0.0 | 0.0 | 0.0 | 0.0 | 0.0 | 0.0 | ... | 0.0 | 0.0 | 0.0 | 0.0 | 0.0 | 0.0 | 0.0 | 0.0 | 0.0 | 0.0 |
250 rows × 350 columns
sns.heatmap(data=df_heatmap, cmap="seismic")
plt.xticks([])
plt.yticks([])
sns.despine()


