Lab 4: Data analysis with Python
In this lab you work on applying your new Python skills to work with data - finally!
This lab must be completed individually.
Where provided, try your best to match the Sample Output as best as you can.
Accept the lab
To accept this lab on GitHub Classroom, LINK
Objectives
Practice Python functions
Practice Python mathematical operations
Practice importing and using the Pandas module
Practice working with seaborn plots
# Usually all the import statements are at the top of the file

import pandas as pd
import seaborn as sns
import numpy as np
import os
A: Creating Functions (3 marks)
In your projects, you may need to create your own functions to do some complex calculations (beyond mean, median etc…). In this question you will write a function to find the roots of a quadratic equation.
To refresh your memory from high school math, a quadratic function looks like this:
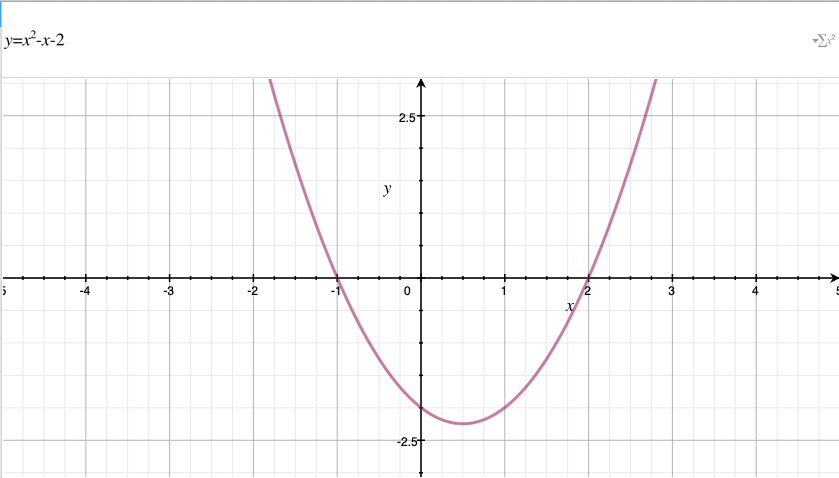
Given the standard form of a quadratic equation, \(ax^2 + bx + c = 0\) where a, b, c are known real numbers and \(a\neq0\), the quadratic formula to find unknown \(x\) is: $\(x=\frac{-b ± \sqrt{b^2-4ac}}{2a}\)$
Write a python function that calculates and prints all possible real (i.e. non-complex) answers for \(x\).
Check your function by running it on some test data points:
solution(1,1,1),solution(1,0,-4),solution(1,2,1).
Sample Output
–> For a=1, b=1, and c=1:
The equation does not have any real solution
–> For a=1, b=0, and c=-4:
x1 = 2.0 and x2 = -2.0
–> For a=1, b=2, and c=1:
x = -1.0
def solution(a, b, c):
    # Your solution here

    if a==0:
        print("Please try again, the `a` term needs to be non-zero.")
    else:
        print("--> For a={}, b={}, and c={}:".format(a,b,c))
        if (b**2-4*a*c) <0:
            print("This equation does not have a real solution")
        elif (b**2-4*a*c) ==0:
            x = (-b)/(2*a)
            print("x = {}".format(x))
        else:
            x1 = (-b + (b**2-4*a*c)**0.5)/(2*a)
            x2 = (-b - (b**2-4*a*c)**0.5)/(2*a)
            print("x1 = {} and x2 = {}".format(x1,x2))
solution(1,1,1)
--> For a=1, b=1, and c=1:
This equation does not have a real solution
solution(1,0,-4)
--> For a=1, b=0, and c=-4:
x1 = 2.0 and x2 = -2.0
solution(1,2,1)
--> For a=1, b=2, and c=1:
x = -1.0
B: Functions (Total: 6 marks)
Remember in lab 2, you used tree to show a map of all directories and files within a directory. In this section, we want to make a similar program, but using python instead.
B1. ListFiles() (2 marks):
Task: Your task is to create a python function called ListFiles() that takes in a directory path and then finds and print all the files (not directories) in a given directory (relative to ./).
We suggest you use the listdir() function and isfile() functions from the os module.
In your GitHub repository, there is a folder called directory_list which contains some sample files.
Hint 1: don’t forget to first import os to use os.listdir() and os.path.isfile().
Hint 2: You can see the following tutorials if you need some extra help or some worked examples: link1 and link2.
Sample Output
directory/file1.txt
directory/file2.txt
directory/file3.txt
directory/file4.txt
import os
def ListFiles(address):
    # Your Solution here

    for i in os.listdir(address):
        if os.path.isfile("{}/{}".format(address,i)):
            print("{}/{}".format(address,i))
ListFiles("directory_list")
---------------------------------------------------------------------------
FileNotFoundError                         Traceback (most recent call last)
<ipython-input-8-6a896d3fc113> in <module>
----> 1 ListFiles("directory_list")

<ipython-input-7-122538586970> in ListFiles(address)
      2     # Your Solution here
      3
----> 4     for i in os.listdir(address):
      5         if os.path.isfile("{}/{}".format(address,i)):
      6             print("{}/{}".format(address,i))

FileNotFoundError: [Errno 2] No such file or directory: 'directory_list'
B2. ListDirectories() (2 marks):
Task: Use the os.listdir() and os.path.isdir() function to find and print all the directories (not files) in a given folder.
Create a python function ListDirectories(path) that prints all the directories in that folder (and subfolders).*
Sample Output (order does not matter)
directory_list/dir2/
directory_list/dir4/
directory_list/dir3/
directory_list/dir1/
def ListDirectories(address):
    # Your Solution here

    for i in os.listdir(address):
        if os.path.isdir("{}/{}".format(address,i)):
            print("{}/{}/".format(address,i))
ListDirectories("directory_list")
---------------------------------------------------------------------------
FileNotFoundError                         Traceback (most recent call last)
<ipython-input-11-4c89510a0842> in <module>
----> 1 ListDirectories("directory_list")

<ipython-input-10-0063707bee4c> in ListDirectories(address)
      2     # Your Solution here
      3
----> 4     for i in os.listdir(address):
      5         if os.path.isdir("{}/{}".format(address,i)):
      6             print("{}/{}/".format(address,i))

FileNotFoundError: [Errno 2] No such file or directory: 'directory_list'
B3. tree() (2 marks):
Task: Write a function tree(path) that prints a map of all directories AND files within a directory.
Hint: you can use the functions you created above, or you may use the os.walk() function to complete this task (there are many ways to do it). Another option is to use glob. You can explore multiple solutions if you like.
Sample Output
directory_list/file1.txt
directory_list/file2.txt
directory_list/file3.txt
directory_list/file4.txt
directory_list/dir1/
directory_list/dir1/file24.txt
directory_list/dir1/file23.txt
directory_list/dir2/
directory_list/dir2/file34.txt
directory_list/dir3/
directory_list/dir3/file110.txt
directory_list/dir3/file140.txt
directory_list/dir3/file130.txt
directory_list/dir3/file120.txt
directory_list/dir4/
directory_list/dir4/file11.txt
directory_list/dir4/file12.txt
directory_list/dir4/file13.txt
directory_list/dir4/file14.txt
def tree(path):
    # Your Solution here
    for i in os.listdir(path):
        if os.path.isdir("{}/{}".format(path,i)):
            print("{}/{}/".format(path,i))
            tree("{}/{}".format(path,i))
        else:
            print("{}/{}".format(path,i))
# Test your function
tree("directory_list")
---------------------------------------------------------------------------
FileNotFoundError                         Traceback (most recent call last)
<ipython-input-13-3ee0fa59eab9> in <module>
      1 # Test your function
----> 2 tree("directory_list")

<ipython-input-12-0ed2a508d6f3> in tree(path)
      1 def tree(path):
      2     # Your Solution here
----> 3     for i in os.listdir(path):
      4         if os.path.isdir("{}/{}".format(path,i)):
      5             print("{}/{}/".format(path,i))

FileNotFoundError: [Errno 2] No such file or directory: 'directory_list'
C: numpy (Total: 8 marks)
In this section, we will practive using the numpy library.
First, import the numpy library
import numpy as np
C1. Create a vector (3 marks)
Task: Create an empty vector of size 10 filled with NaN.
Hint: you need to use zeros() method or the empty() method
# Your Solution here

np.empty(10) + np.nan
array([nan, nan, nan, nan, nan, nan, nan, nan, nan, nan])
C2. Working with Vectors (2 marks)
Task: Create a random vector of size 10 and then find its mean, max, min, and sum value.
Hint: for random vector you need to use np.random.random() and for the mean, max, min, sum you need to use build-in numpy methods mean(),max(),min(),sum().
Sample output (Your numbers will be different)
[0.66698639 0.32937943 0.12074085 0.21788496 0.75628444 0.56461791 0.38162184 0.60966053 0.00491222 0.80007239]
The max is: 0.800
The min is: 0.005
The sum is: 4.452
The mean is: 0.445
# Your Solution here

v = np.random.random(10)
print(v)
print('The max is: {:0.3f}'.format(v.max()))
print('The min is: {:0.3f}'.format(v.min()))
print('The sum is: {:0.3f}'.format(v.sum()))
print('The mean is: {:0.3f}'.format(v.mean()))
[0.79815213 0.08737428 0.3237815  0.26334844 0.82504506 0.6862381
 0.30573611 0.95406859 0.7034509  0.34440498]
The max is: 0.954
The min is: 0.087
The sum is: 5.292
The mean is: 0.529
C4. More vectors (3 marks)
Task: Using numpy Create a vector of size 15 which contains random values ranging from 10 to 90 and replace the minimum value with 100 and maximum value with 0. Print the mean, befor and after.
Hint: you may need to use argmax() and argmin().
Documentation for that can be found here.
Sample output
before: [20 27 10 63 57 71 50 18 76 56 38 62 10 9 12]
mean: 38.6
after: [ 20 27 10 63 57 71 50 18 100 56 38 62 10 9 12]
mean: 40.2
# Your solution

v = np.random.randint(10,90,15)
print("before:", v)
print("mean:", v.mean())
v[v.argmax()] = 0
v[v.argmin()] = 100
print("after:", v)
print("mean:", v.mean())
before: [11 40 19 85 36 17 31 72 76 18 70 35 23 23 85]
mean: 42.733333333333334
after: [ 11  40  19 100  36  17  31  72  76  18  70  35  23  23  85]
mean: 43.733333333333334
D. Plotting using Seaborn (and matplotlib) (Total: 16 marks)
matplotlib is a Python library for data visualization.
seaborn is a statistical data visualization library layer that provides a high-level interface for drawing statistical graphics and some convenient functions for plotting data frames.
You may need to install seaborn and matplotlib
conda install seaborn
conda install matplotlib
and just in case it’s not the latest version, go ahead and update it:
conda update matplotlib
conda update seaborn
import matplotlib.pyplot as plt
import seaborn as sns

# There are five preset seaborn themes: darkgrid, whitegrid, dark, white, and ticks.
# They are each suited to different applications and personal preferences.
# You can see what they look like [here](https://seaborn.pydata.org/tutorial/aesthetics.html#seaborn-figure-styles)

# Just for fun, we're going to set the theme to be a nice one:
sns.set_theme(style="ticks",
              font_scale=1.3, # This scales the fonts slightly higher
             )
# And we're going to remove the top and right axis lines
plt.rc("axes.spines", top=False, right=False)
D1. Load data (1 mark)
Without downloading the csv file to your repo, load the “BCCDC_COVID19.csv” file using the direct URL: “http://www.bccdc.ca/Health-Info-Site/Documents/BCCDC_COVID19_Dashboard_Case_Details.csv”.
DO NOT DOWNLOAD THE DATA TO YOUR REPOSITORY!
Use pandas module/package and the read_csv() function to load the data by passing in the URL and then save the data in a variable called df.
# Your solution
import pandas as pd
df = pd.read_csv('http://www.bccdc.ca/Health-Info-Site/Documents/BCCDC_COVID19_Dashboard_Case_Details.csv')
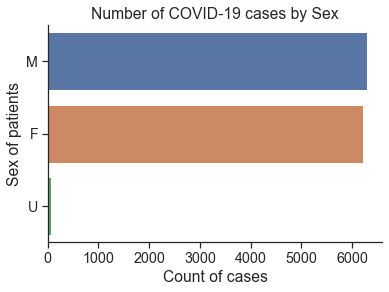
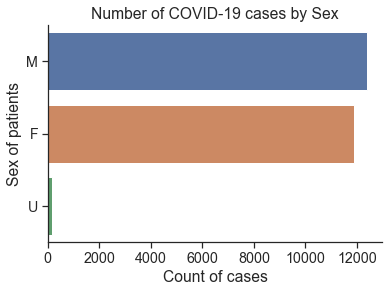
D2. Counts of cases by Sex (2 marks)
Using sns.countplot(), plot the number of all female and male cases.
Set the title to be “Number of COVID-19 cases by Sex”.
Hint: The documentation above contains some examples that might help you get started
Sample output
# Your Solution here
sns.countplot(y='Sex',data=df)
plt.title('Number of COVID-19 cases by Sex')
plt.xlabel('Count of cases')
plt.ylabel('Sex of patients')
Text(0, 0.5, 'Sex of patients')
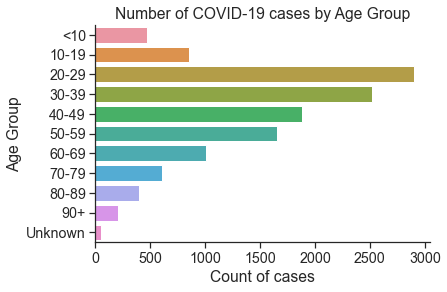
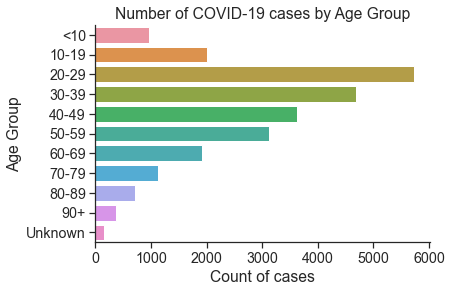
D3. Counts of cases by Age Group (2 marks)
Plot the counts of cases by age group, and order the y-axis by increasing age (use the order parameter of the countplot() function).
# Your Solution here

order = ['<10',
         '10-19',
         '20-29',
         '30-39',
         '40-49',
         '50-59',
         '60-69',
         '70-79',
         '80-89',
         '90+',
         'Unknown']

sns.countplot(y='Age_Group',data=df,order=order)
plt.title('Number of COVID-19 cases by Age Group')
plt.xlabel('Count of cases')
plt.ylabel('Age Group')
Text(0, 0.5, 'Age Group')
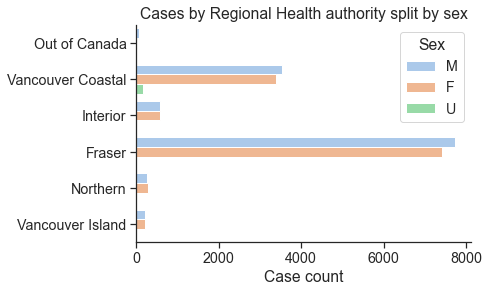
D4. Cases by regional health authority (3 marks)
Using set() data type, find the all the different regions in df['HA']. In the next step, calculate the count of all cases in each of those regions. Finally, using plt.barh, plot a horizontal bar chart of number of cases based on their regions.
Hint: More information and examples can be find in link
Hint: Your plot doesn’t have to look exactly like this, but please do explore the possible color palettes. You can specify the colour palette by passing in the keyword like this: palette='colorblind'.
Sample output
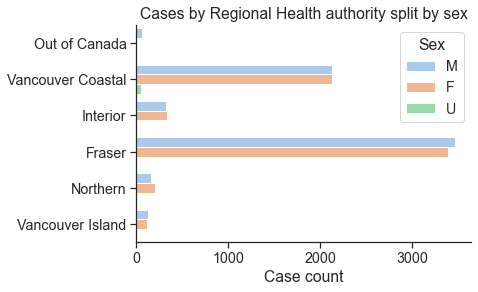
# Your solution here

sns.countplot(y='HA',data=df,hue='Sex',
              palette='pastel')
plt.xlabel('Case count')
plt.ylabel('')
plt.title('Cases by Regional Health authority split by sex')
Text(0.5, 1.0, 'Cases by Regional Health authority split by sex')
D5. Data Wrangling I (2 marks)
Task: Add a new column to the dataframe to convert the “Reported_Date” column to a datetime object
To do this, first we need to add a new column to our dataset to turn the column “Reported_Date” into a proper datetime object so we can do operations on it.
Hint: Use to to_datetime() function to help you first convert it into a datetime object, and then remove the timezone information and HH:MM:SS using .dt.date.
# Your Solution here

df['Reported_Date_Object'] = pd.to_datetime(df['Reported_Date']).dt.date
D6. Data Wrangling II (1 mark)
Task: Find the earliest reported case and the latest reported case of COVID-19 in the dataset
You should use the pandas .min() and .max() functions here, now that your date string is converted to a DateTime object.
Sample Output
The earliest reported case of COVID-19 was: 2020-01-26
The latest reported case of COVID-19 was: 2020-10-23
# Your Solution here

print('The earliest reported case of COVID-19 was: {0}.'.format(df['Reported_Date_Object'].min()))
print('The latest reported case of COVID-19 was: {0}.'.format(df['Reported_Date_Object'].max()))
The earliest reported case of COVID-19 was: 2020-01-26.
The latest reported case of COVID-19 was: 2020-11-18.
D7. Data Wrangling III (2 marks)
Task: Create a new column in the data frame called “days_since”.
This column will be of type integer, and will simply show the days since the first reported case of COVID-19.
Hint: Subtracting the earliest reported date from the Reported_Date_Object column will get you most of the way there. After that, the only thing left to is to turn the result (a datetime object) into an integer using .dt.days.
# Your Solution here

df['days_since'] = (df['Reported_Date_Object'] - df['Reported_Date_Object'].min()).dt.days
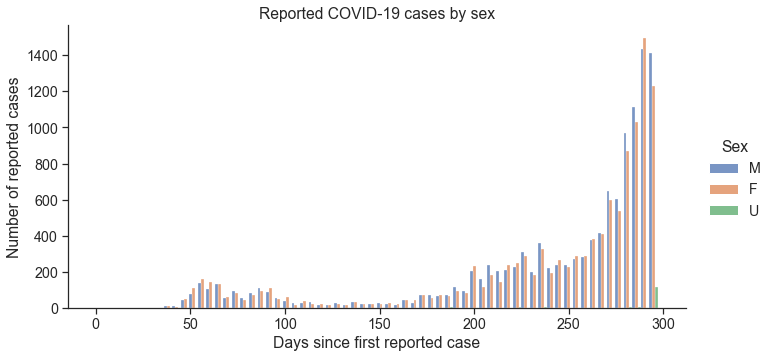
D8. Plot the COVID-19 cases plotted over time by sex (3 mark)
Using sns.displot, plot the histogram of females and males cases over time.
Hint 1: Here is a nice tutorial of all the different options that are possible when creating a histogram.
Sample output
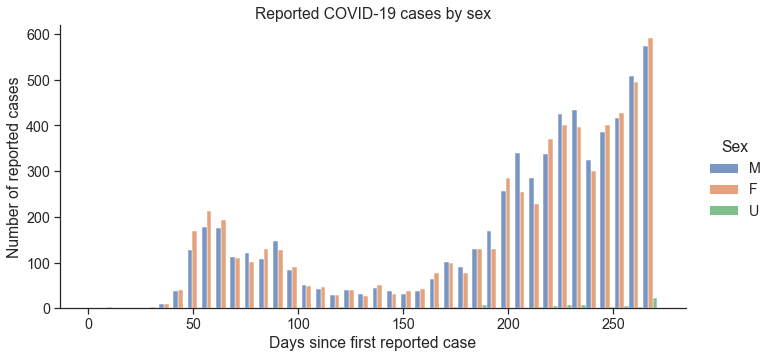
# Your solution here

ax = sns.displot(df,
            x='days_since',
            hue='Sex',
            multiple='dodge',
            aspect=2,
           )

plt.xlabel('Days since first reported case')
plt.ylabel('Number of reported cases')
plt.title('Reported COVID-19 cases by sex')
Text(0.5, 1.0, 'Reported COVID-19 cases by sex')
D8. BONUS - For a bonus mark, move the legend to the top left of the plot (1 mark)
# Your solution here
D8. BONUS - For a bonus mark, order the Health authorities on the y-axis (1 mark)
You can order it by some metric (either alphabetically, or by total counts, or some other sensible metric)