Lab 5: Excel - Analyzing and Reporting Data
In this Lab, we will shift gears a bit and you will be working with Microsoft Excel to practice your data analysis skills.
Instructions
In this lab, we will use Microsoft Excel to manipulate, transform, and analyze data. Please note that Microsoft Excel must be used to complete this lab. It may be possible to use other spreadsheet software such as Google Sheets, LibreOffice, or similar. If you do not have a copy of Excel, you can find a link on the Install Stack to help you install it on your computer.
This lab is to be completed individually.
Objectives
Load CSV data into Excel and convert into a spreadsheet for processing.
Perform simple data cleaning (missing, incorrect) values, data type conversion, and cell formatting.
Understand and use Excel cell addressing including absolute addresses.
Create formulas including string and date functions, aggregate functions, and formulas with decisions.
Perform sorting and filtering to transform data for analysis.
Produce charts to visualize data and communicate results including using trendlines and sparklines.
Analysis Problem and Goals
This scenario involves analyzing data collected by sensors and applies to a variety of real-world applications including environmental monitoring (temperature, precipitation, wind, etc.), industrial and production sensors, and even monitoring of people using mobile devices and GPS. There are multiple monitoring sites. Each site has one or more sensors that take a reading in a given interval. Typically, readings are either an integer or floating-point value. In this lab, each reading will consist of:
timestamp - when the reading occurred
siteid - an integer identifying a site uniquely
sensorid - an integer identifying a sensor at a particular site uniquely
value - an integer reading between 0 and 100, although data may be missing or incorrect
Sensor readings are done every 15 minutes but may be missed (no data) or contain incorrect values out of range (less than 0 and above 100) or values that indicate error conditions (not at a number at all).
Click here to download the data set that consists of 4 sites each with 3 sensors that take readings every 15 minutes for 2 days.
Goals
The analysis goals are:
Loading - load the input CSV file into Excel and convert into an Excel spreadsheet file.
Cleaning - take the raw data and remove missing/incomplete values and convert the time currently in string form to an Excel datetime.
Summary - calculate summary statistics for the data set including number of readings, maximum/minimum values, and readings for particular sensors.
Transformation - transform the data set so that it is easier to analyze by creating a table where each row has a timestamp and readings in each column for every sensor at the site at that time.
Visualization - create a chart that shows the sensor readings by time with trendlines.
Analysis - will determine if there are any trends for the three sensors at site 1.
Marking and Evaluation (15 marks)
Loading (1 mark) - Create an Excel file called lab1_(yourstudentnum).xlsx (e.g. lab1_11111111.xlsx) where the first sheet is called rawdata and contains the loaded data set with no changes.
Cleaning and Formatting (5 marks) - create a second sheet called data that contains the data set after all incorrect and out-of-range values have been removed.
Any data that is not a number, is less than 0, or above 100 should be replaced by an empty string (“”) (1 mark). Hint: May need to use IF function.
Header fields must be in bold font (0.5 marks).
Timestamp field must be formatted as a date field in this format yyyy/mm/dd hh:mm:ss (2 marks). Hint: May need to use DATEVALUE function and function like MID to convert date. More info. Note that both the DATE and TIME need to be converted and added together to get a DATETIME.
Data must be sorted by siteid (ascending), sensorid (ascending), then timestamp (ascending) (0.5 marks).
Add a column called global_sensor_id that is generated by siteid&”_”&sensorid (1 mark).
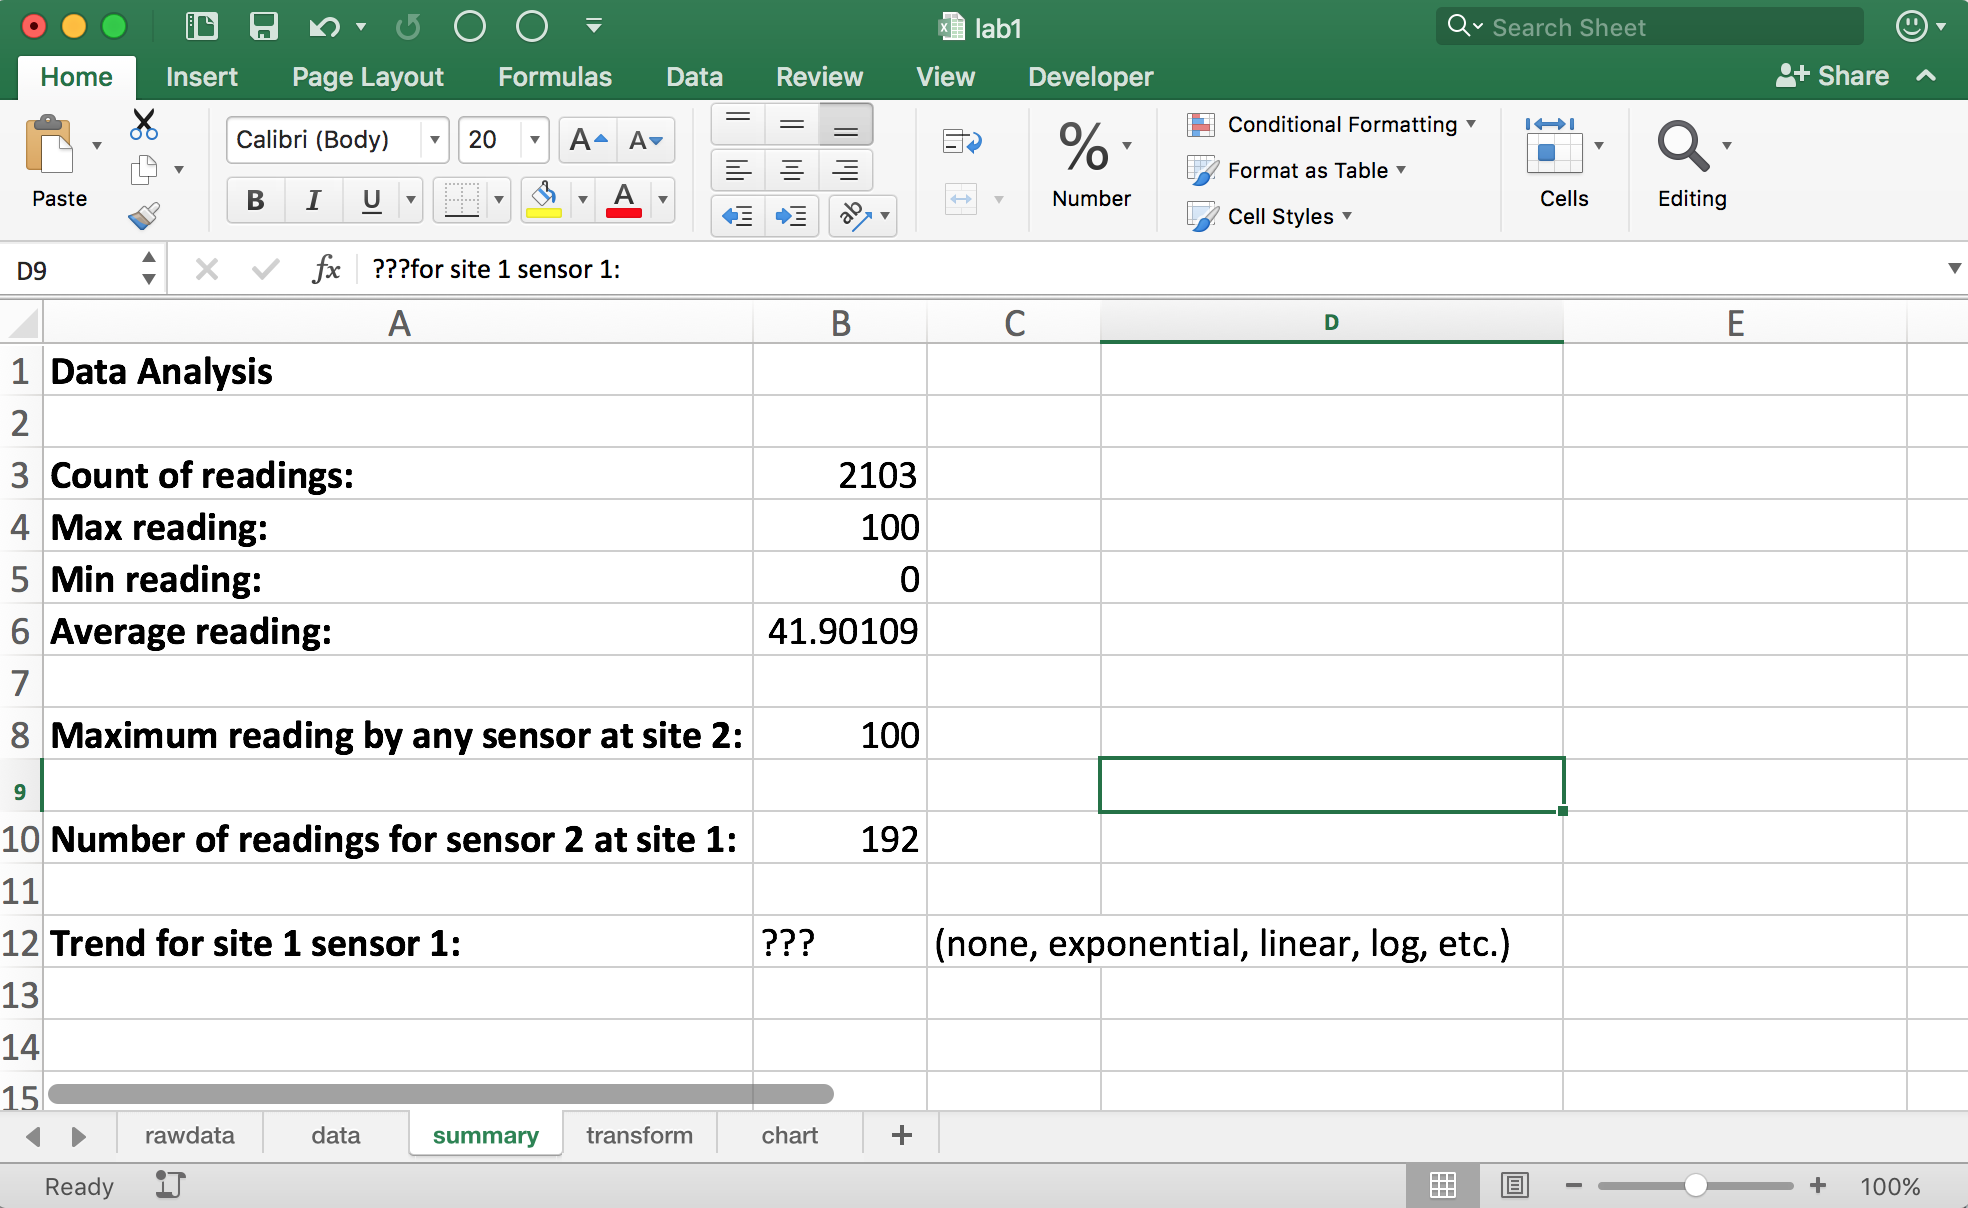
Summary (3 marks) - create a third sheet called summary that contains the following items:
Count of readings in B3, maximum reading value in B4, minimum reading value in B5, average reading in B6 (1 mark).
Maximum reading by any sensor at site 2 in B8 (1 mark). Hint: Ctrl+Shift+Enter will be useful. See: Array Output using Ctrl+Shift+Enter
Number of readings for sensor 2 at site 1 in B10 (1 mark). Note: Include all readings including readings that were out of range/errors/blank.
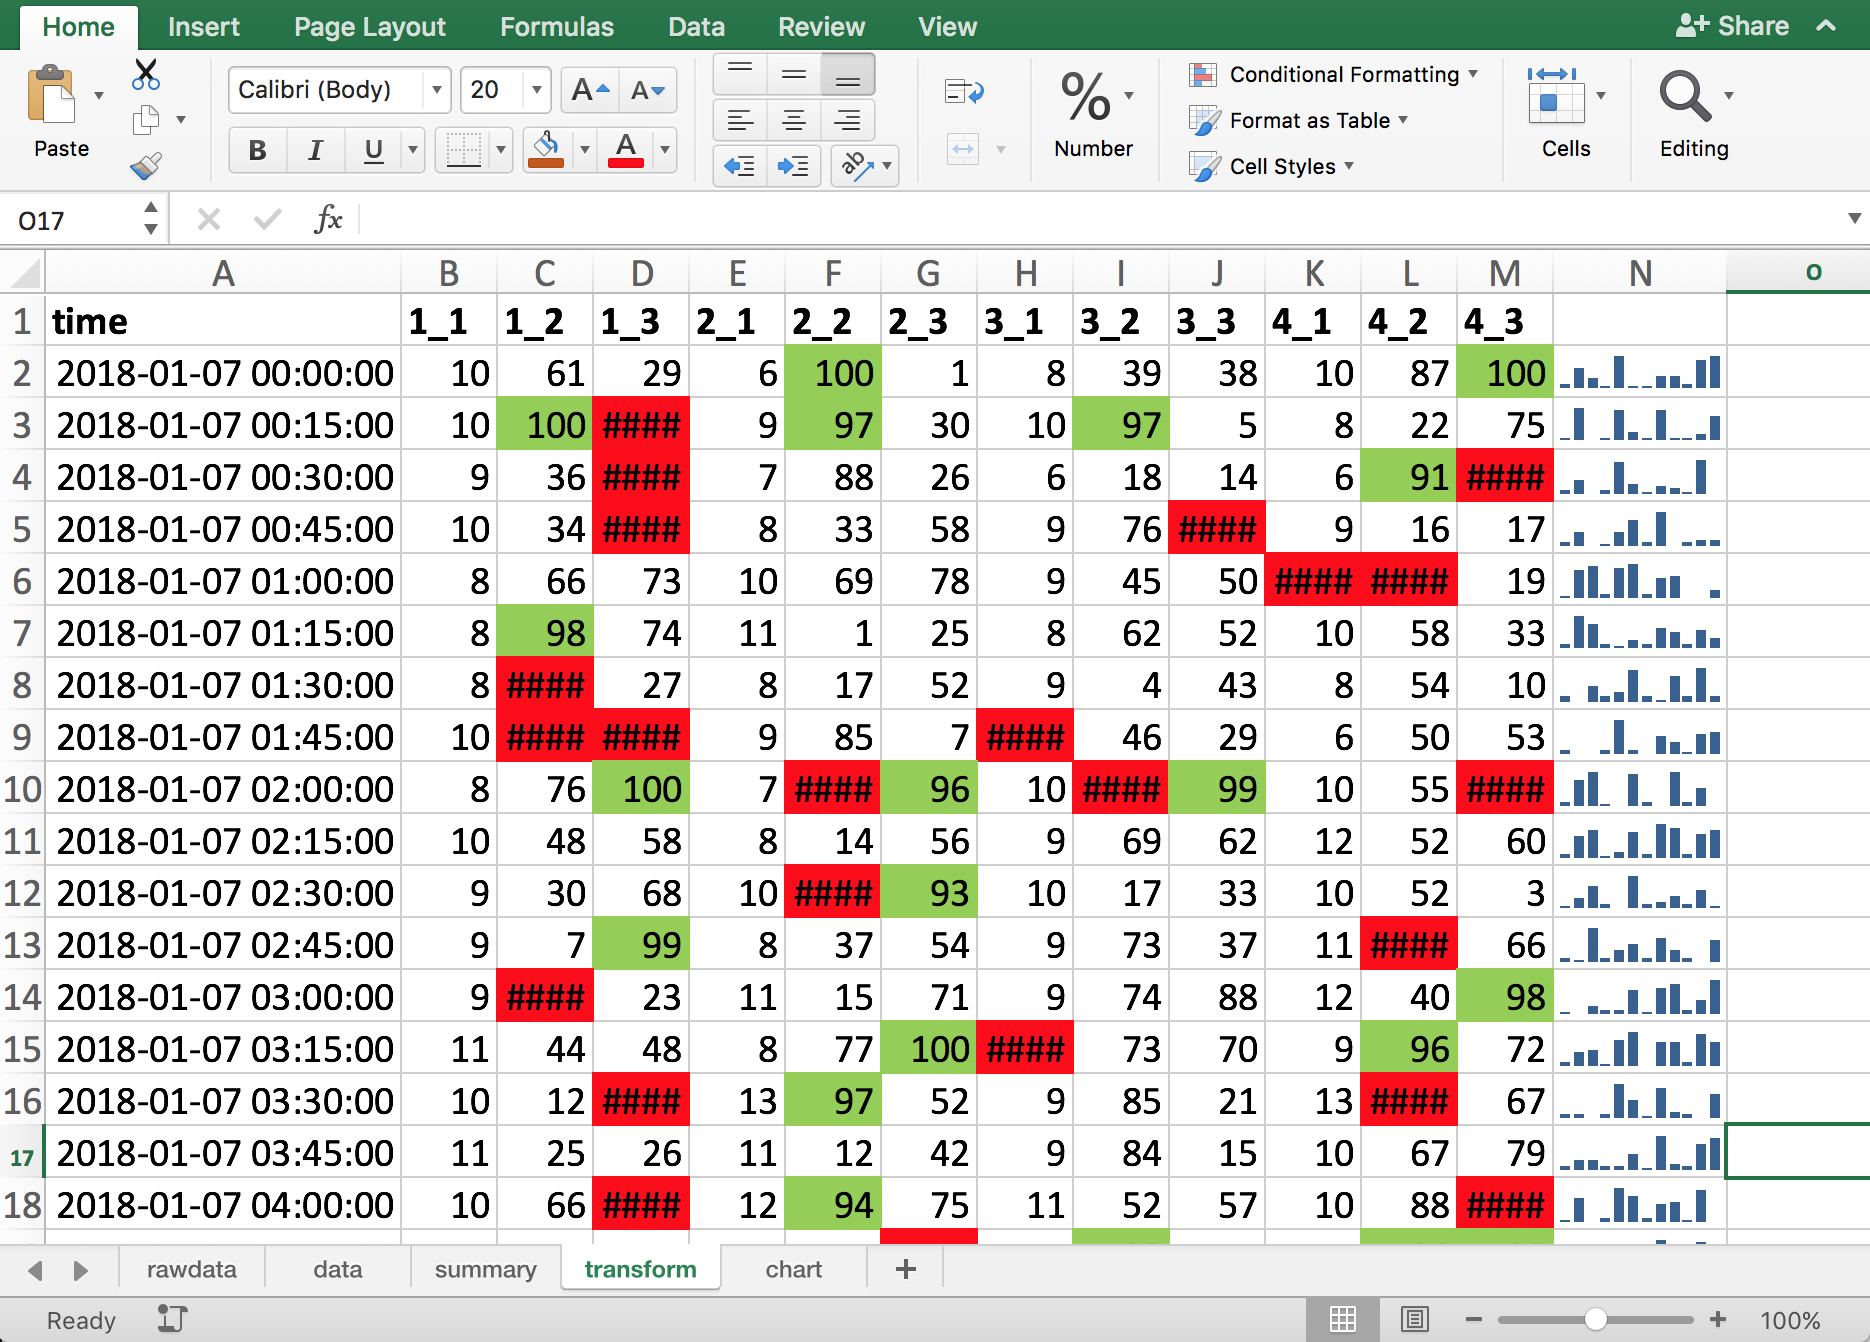
Transformation (3 marks) - create a fourth sheet called transform that contains a table where each row is a time and each column contains values for the sensor.
Creating data table (1 mark).
Replacing missing values with NA() (0.5 marks). More info and Using ISNA() function
Adding sparklines in last column for each row (0.5 marks).
Add conditional formatting so that cells with #N/A are filled in red and cells with values >= 90 are filled in green (1 mark).
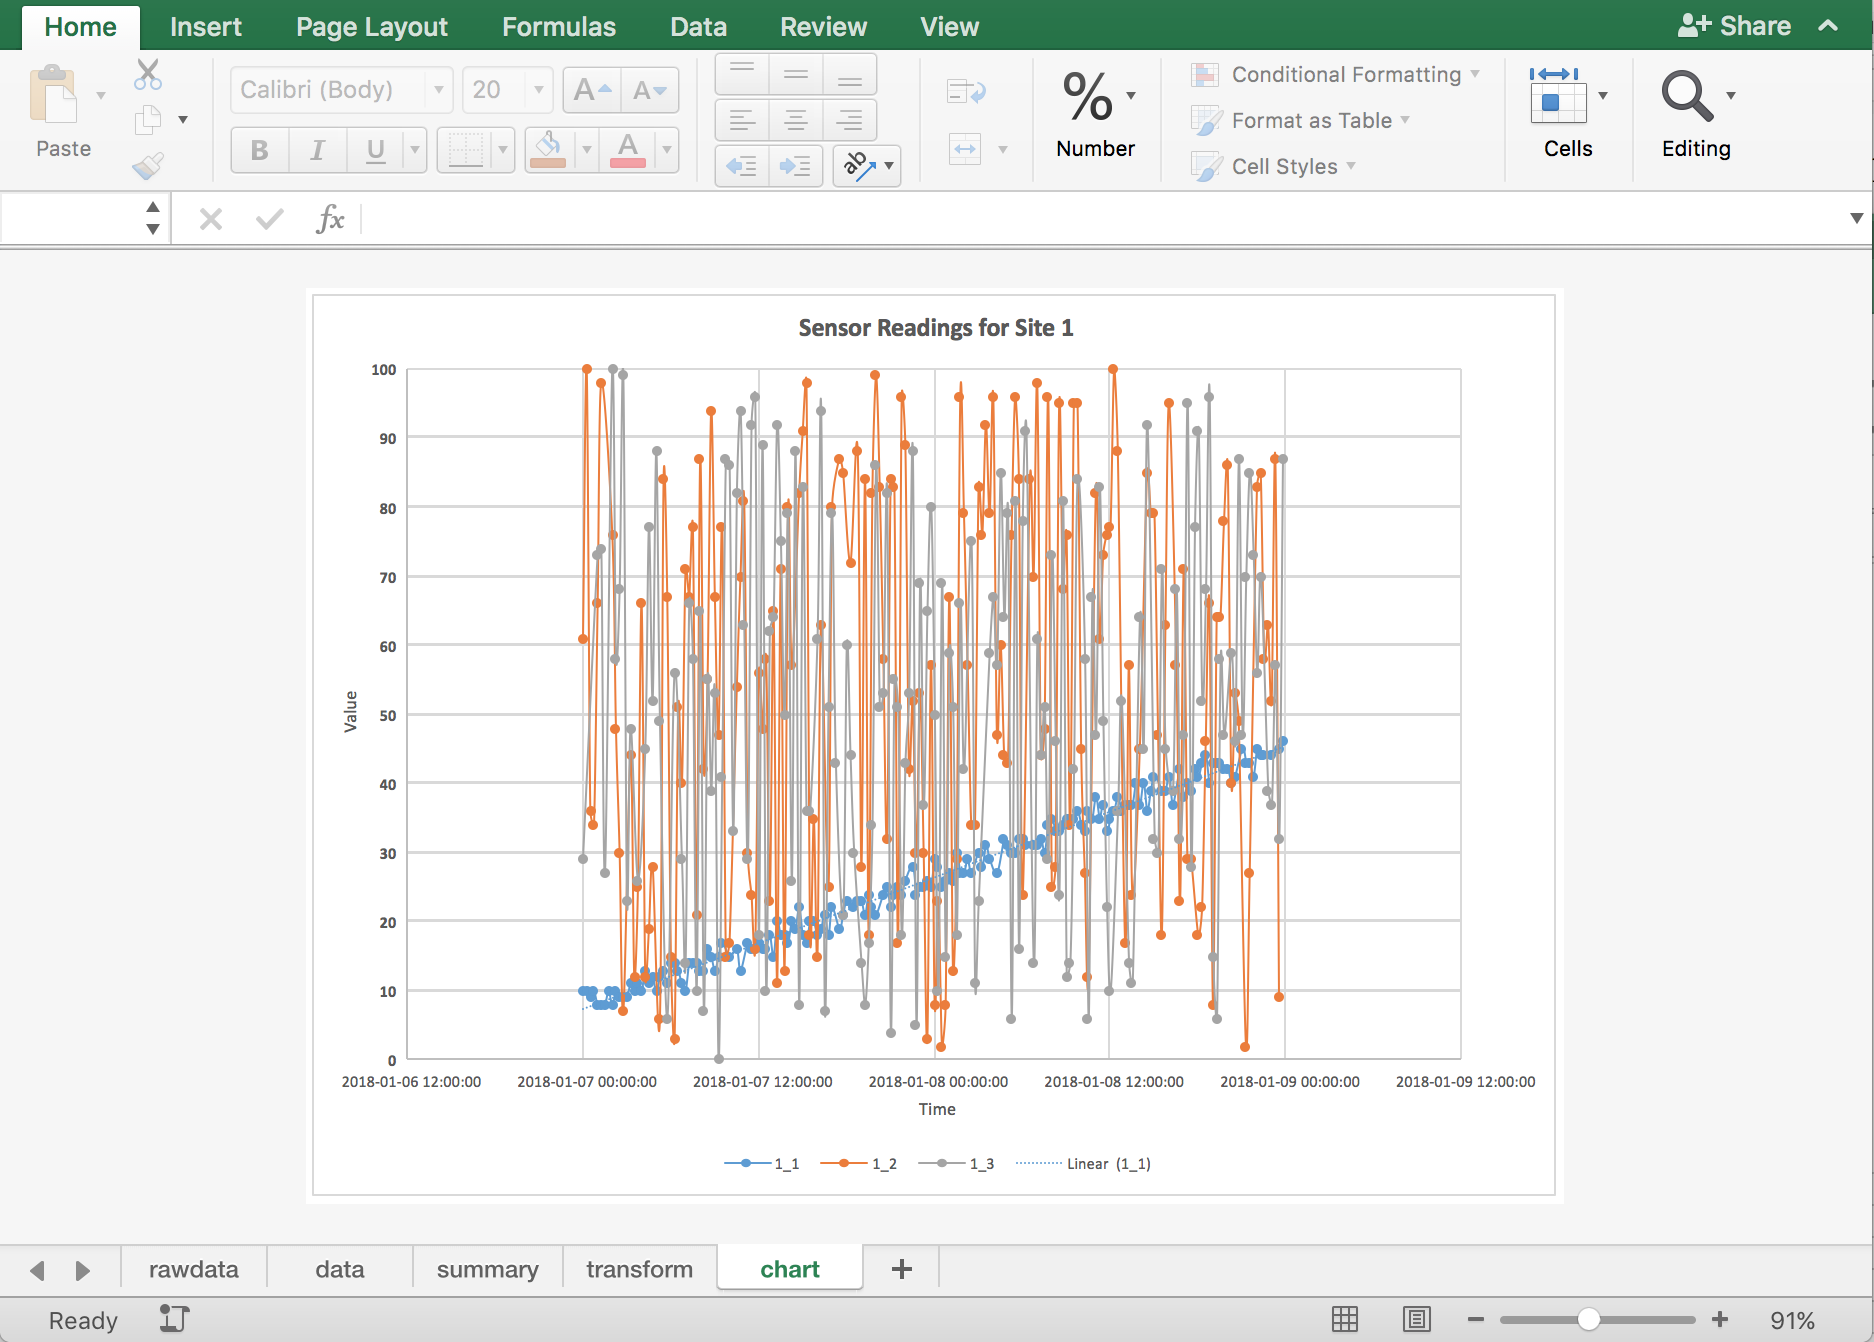
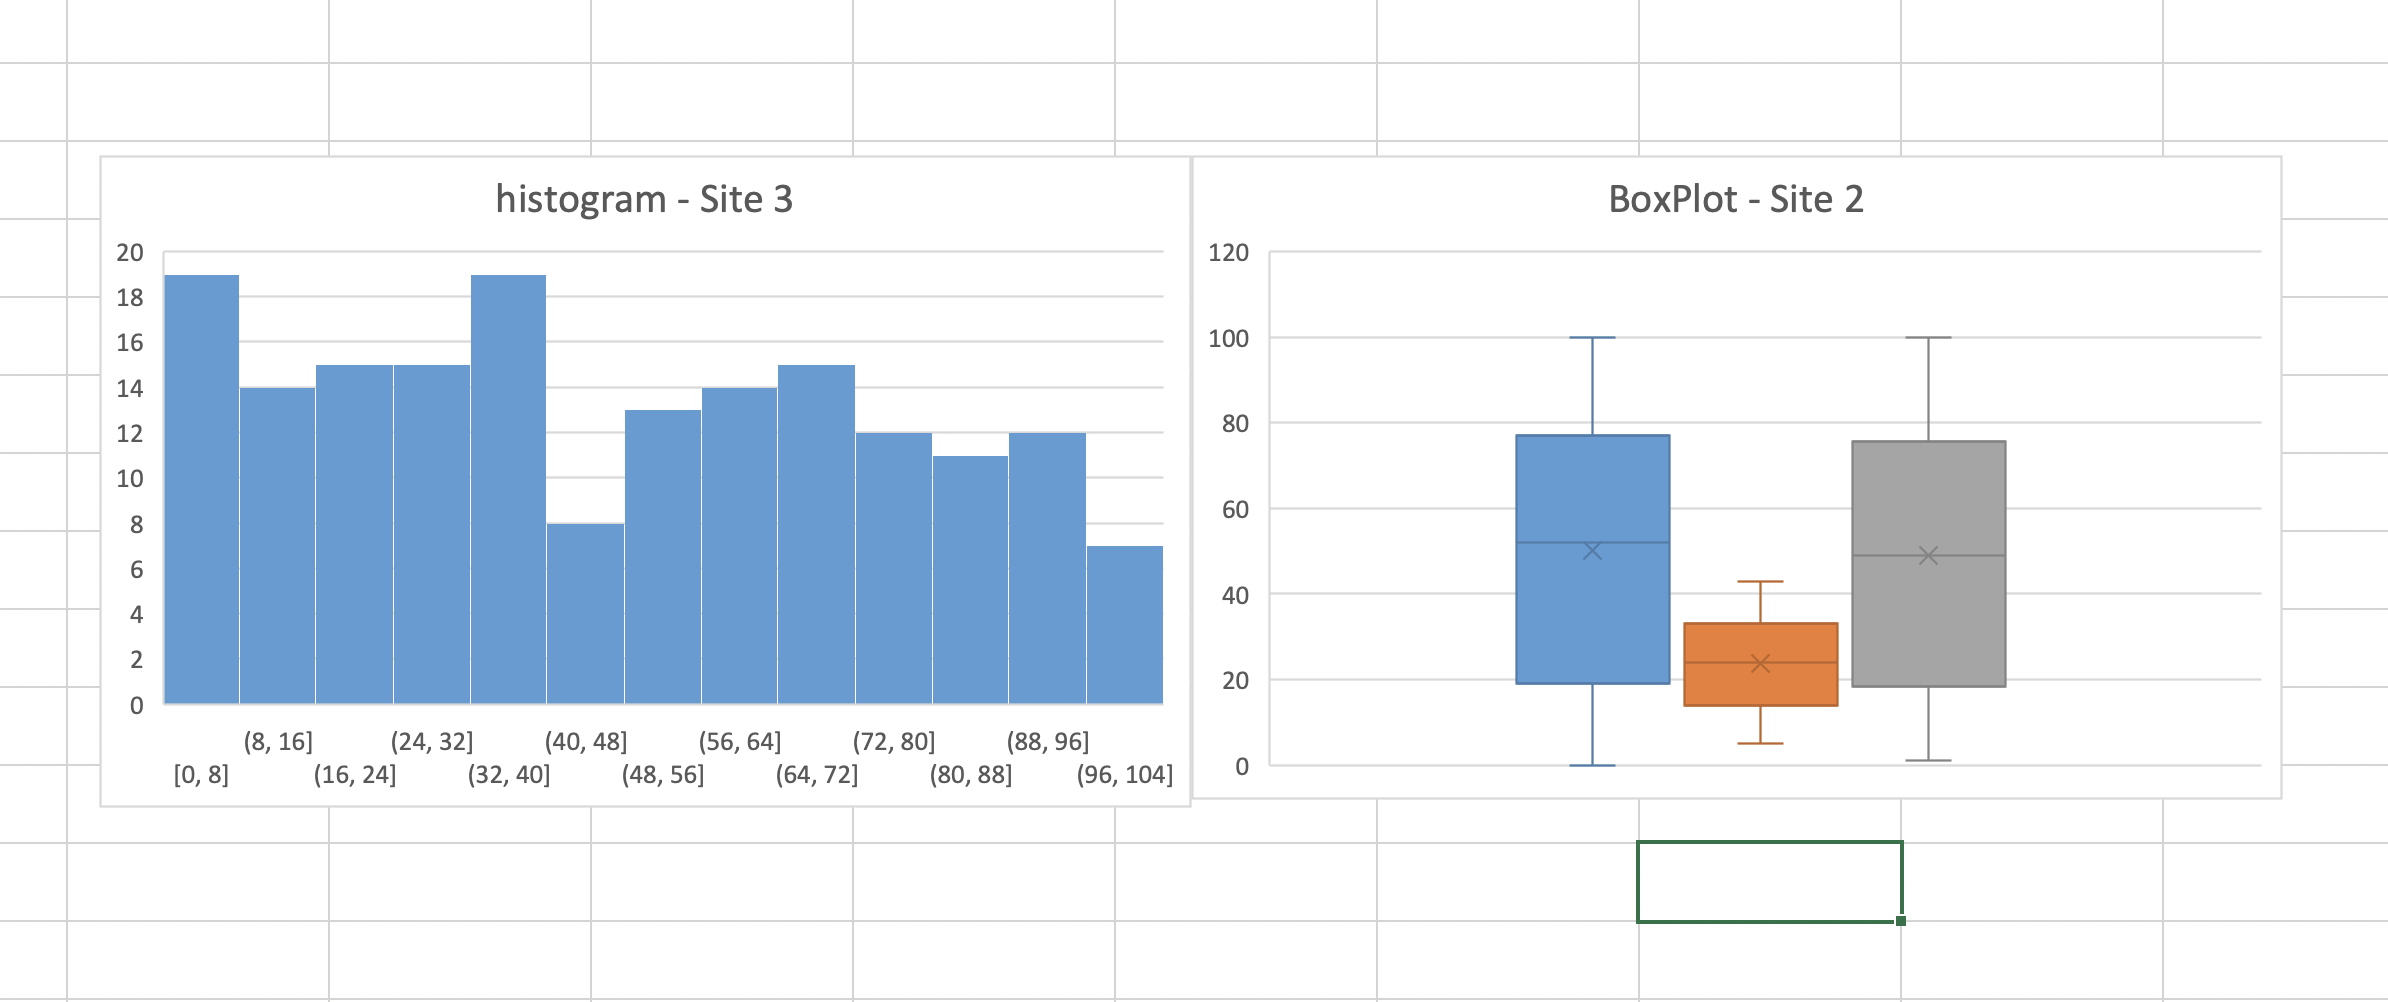
Visualization (2 marks) - create a XY Scatter chart (with smooth lines and markers) on a sheet called chart that shows the readings by time for all three sensors at site 1. Add an appropriate trendline for sensor 1 at site 1. Also, using all the data from site 3, make a histogram to show the overall distribution of the data(you can use bin size of 10) and use a box plot to show the distribution of data from site 2 for each sensor separately.
Analysis (1 marks) - in the summary sheet put in cell B12 if sensor 1 at site 2 has any data trend (none, exponential, linear, etc.).
Note: The screenshots are provided as an approximate reference.
When complete, commit your changes to the remote repository (push all changes), update the link for your Explainer Video, and submit your lab on Gradescope.
Screenshots
For your reference, below are some screenshots to show you what some of our expectations are.
Please note that the data set that is used in the example is different that what you are using meaning that the numerical values will be different that what you calculate.
rawdata sheet

data sheet

summary sheet
transform tab
Lab 5 Explainer Video
Similar to last week, for each of the labs you submit, you will need to an “Explainer Video” showing highlights of your assignments.
Note that you only need to create one video per lab.
General suggestions for Explainer Videos:
Important: If Vimeo and/or YouTube is blocked in your country and you are not able to upload your video to one of those two locations, please contact me on Ed Discussion ASAP and I will give you alternate instructions.
Your video should be a minimum of 5 minutes, and a maximum of 7 minutes.
You do not need to explain every line of code! As a rough guideline, you should try to identify the crucial or central component of the question, and try to explain that.
Thinking about the audience is important. Your explanation of your work would be different if you were explaining things to a peer, or someone who is not familiar with the content.
For the Explainer videos You can assume that your audience is a relatively expert audience that is assessing your ability to explain your work.
We will NOT be assessing “polish” so please do not waste your time doing multiple takes. I don’t care if you say “umm” and “uhh” and “like” etc… just imagine you’re having a conversation with me and speak however is natural to you.
Your videos must be in English, and we will not be checking grammar, pronunciation, accents, speaking style, etc…
Overall, do not be nervous and do not fear the Explainer videos. Only one TA and possibly the instructor will see your video and it will be private.
Use this opportunity to practice extremely important skill in Data Science! You will get better at it by the 5th video, I promise.
If you really, really, really do not want to do Explainer Videos, you can instead choose to write an Explainer Essay instead. Please ask your instructor for permission before you choose this option, there are some guidelines I need to give you.
Here is a video explaining this process in all the details (this is the same video as last week):
Lab 5 specific suggestions for Explainer Video:
You can choose to divide up the 5-7 mins as you like, but please make sure you show us all the portions listed in the “Goals” section.
Have fun!
Link to your Explainer video:
You should edit THIS file and add a link to your video on Vimeo (preferred) or YouTube here:
Link to my Explainer Video for Lab 5: Click here.