Class 1A - Introduction to Data 301
Welcome!

Essence of this course
The overall goal of this course is for you to:
Understand data analytics and be able to apply data analysis to data sets using a variety of software tools and techniques.
The most exciting aspect of data analytics is discovering and presenting useful data/information that can have an impact on business, society, etc.
This course will provide the tools and skills for you to perform your own data analysis when encountering problems in the real-world.
As an introductory course, the goal is to get exposure to the skills and techniques as there will not be time for mastery.
An Introduction to Data Analytics
Data Analysis vs Data Analytics
Data Analysis:
Data analysis is the processing of data to yield useful insights or knowledge.
Data Analytics:
Data Analytics is the science of examining raw data with the purpose of drawing conclusions about that information.
The distinction between data analysis and analytics is blurry to say the least (even Wikipedia is confused).
One source might say that data analysis is a subcomponent of data analytics, while another source says data analytics is a sub-component of data analysis.
I like to think of data analysis as the method (ie action) whereas data analytics are tools used to do so. Analytics is supported by many tools such as Git, Python, Tableau, Microsoft Excel all of which we will talk about in this course.
There are many other popular tools in Data Analytics such as Microsoft Access, SQL, Docker, and others which we won’t talk much about in this course, but I will provide you some resources and references if you would like to learn more about this.
Why is Data Analytics important?
Data analytics is important as society is collecting more and larger data sets all the time:
Web All web pages visited and links clicked, searches made, images and posts
Business Items purchased by date, supply chain/customers, industrial sensors
Science Massive data sets (biological/genomic, astronomy, physics, healthcare)
Environmental Sensors and monitors (temperature, etc.)
Transforming this raw data into useful insights has major value:
Web Online advertising driven by understanding customer behaviour; tailored google searches, Google Analytics
Business Sales predictions, marketing promotions, manufacturing improvement
Science Scientific discoveries, new medical treatments and drugs; see some examples in healthcare.
Environmental Understanding of environmental processes to allow for changing policies and behaviours, eg Institute of Environmental Analytics
What is a Data Analyst?
Data analyst
A data analyst is a person who uses tools and applications to transform raw data into a form that will be useful.
Vital in a “data-driven” world with larger and more critical data sets.
The first step in data analysis is often data collection/ munging/ processing which involves finding, loading, cleaning, manipulating, transforming, and visualizing the data.
The knowledge may be used for scientific discovery, business decision-making, or a variety of other applications.
Data Analytics Toolkit
A data analyst has expertise in programming, statistics, data munging (transformation), and data visualization.
In this course, you will be introduced to severals tools for gaining competency in each of these skills.
As an introductory course, the goal is to get exposure to the skills and techniques as there will not be time for mastery.
This toolkit of systems and techniques will be useful in many jobs even if they are not considered data analyst positions.
Why is Data Analytics important?
90% of the worlds data have been generated over the last two years Forbes Magazine.
In 2017, Machine Learning Engineers, Data Scientists, and Big Data Engineers ranked among the top emerging jobs on LinkedIn Forbes Magazine.
In 2012 was Data Scientist dubbed the sexiest job of the 21st Century by Harvard Business Review.
An estimated 2.7 million job postings for Data Analytics and Data Science are projected in the United States by 2020 IBM.
Massive Growth of Data - “Big Data”
Data facts from Forbes Magazine, May 21, 2018 Forbes
An estimated 2.5 quintillion bytes (2.5 EB) generated per day.
Google processes about 3.5 billion requests/day and stores about 10 EB of data.
Facebook collects 500 TBs/day (⇠2.5 billion items) and stores 100+ PB of photos.
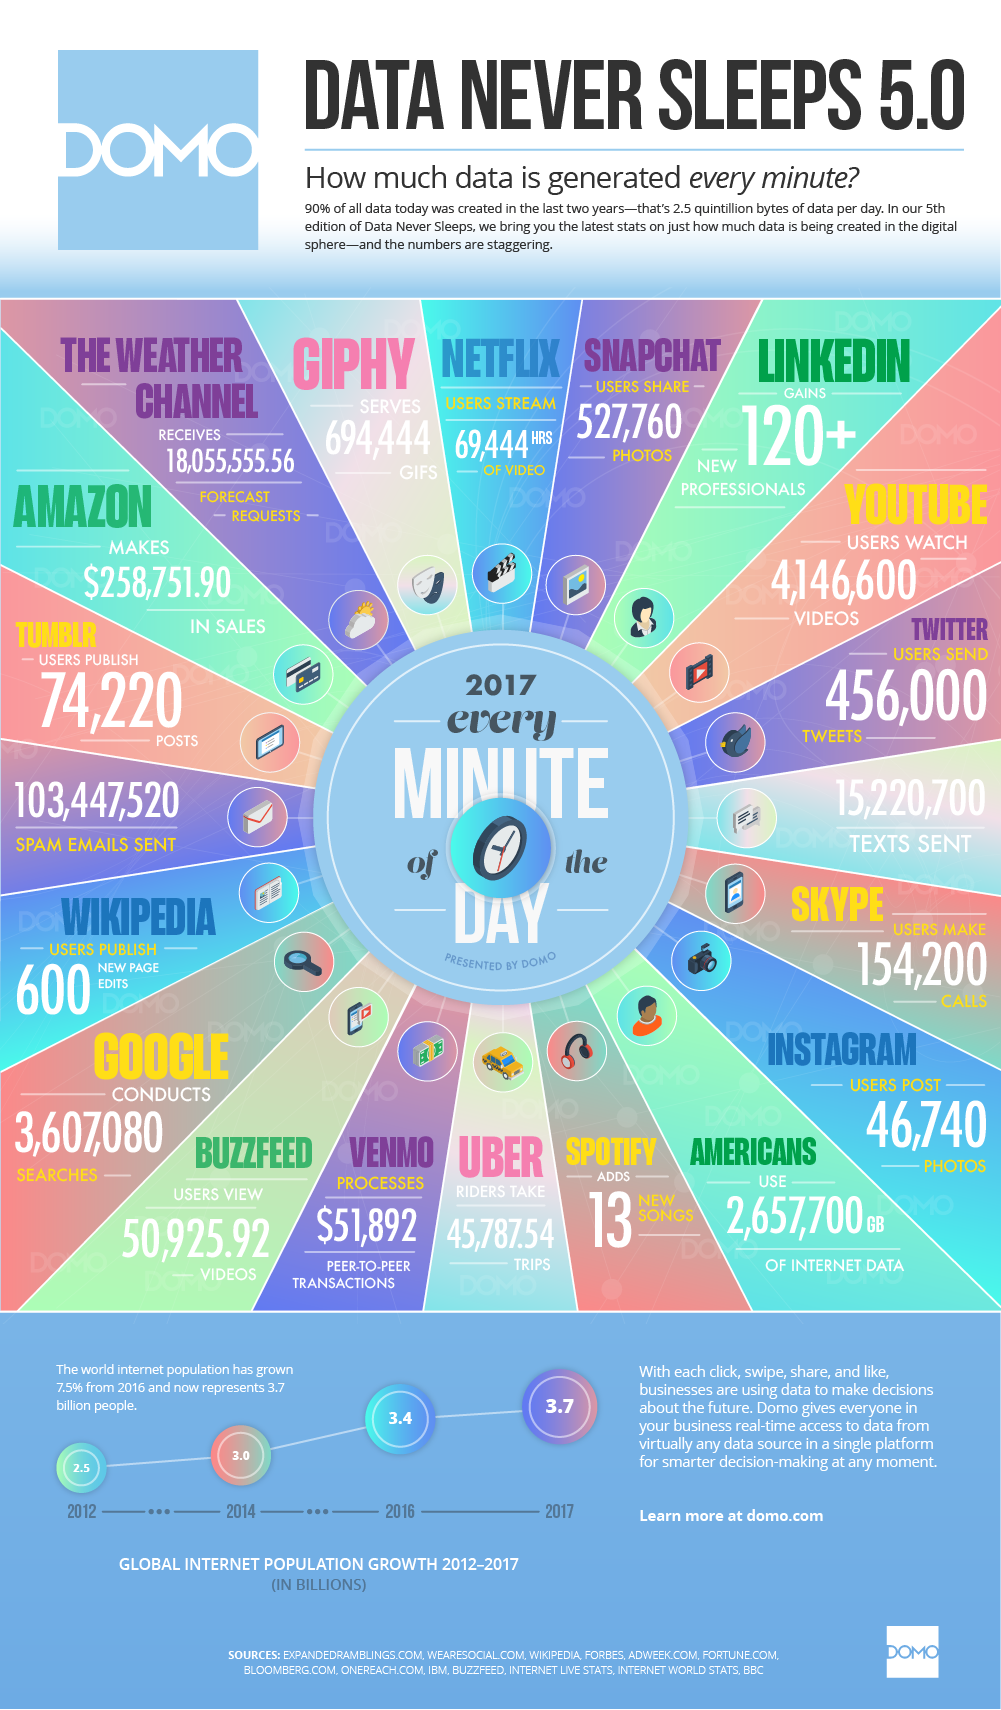
See here on how much data is generated every minute
Users watch 4,146,600 videos every minute on YouTube
Intagram users post 46,740 photos every minute.
Related terms
Other terms that may add confusion to these definitions are…
Data Science is a field comprising everything relating to data cleansing, preparation, and analysis. This umbrella term encompasses data analytics, data mining, machine learning, and several other related disciplines.
Big Data usually refers to immense volumes of data that inhibits the use of traditional data-processing applications.
See this article for more on the differences between Data Science, Big Data, and Data Analytics.
I wouldn’t worry about terms and definitions too much! Just learn the skills, and let others worry about the labels…

Source: The Jenkins Comic
Why is this course important?
For many of you, this will be your first exposure to programming and data analytics.
Regardless of your discipline, the tools you develop throughout this course will train you to think analytically and creatively.
Beyond University, many professional jobs of the future will involve collecting, manipulating, and analyzing data.
People who can understand how data can be used will have better employment opportunities.
Important skills you may learn in this course:
Excel Proficiency: for general data analysis and productivity.
Programming and Computational Thinking: Critical thinking and the ability to clearly articulate a problem in a systematic way has applications beyond data analytics.
Data visualization: how to display and convey information in a meaningful way.
Real-world problem solving: learn to tackle real-world data analysis problems and understand when to use what tool.
Optional, resources provided if you’re interested
Databases: Understand how they work and how to use them.
Applied Statistics: Using R and other software makes your statistics training useful for real-world problems.
What will I learn in this course?
Understand data representation formats and techniques and how to use them.
Work with large datasets and learn to manipulate them programmatically.
Experience using a wide-range of data analytics tools including Excel, Git, Python, Pandas, Tableau, and other visualization packages and software.
Develop a computational thinking approach to problem-solving and use programs to solve data tasks.
Why should You take this course?
This course is one of my favourite courses to teach at UBCO!
It was initially created by Dr. Ramon Lawrence, and has since been updated by various folks including Dr. Patricia Lasserre, Dr. Firas Moosvi, Dr. Irene Vrbik, Dr. Scott Fazackerley, and others.
It is a fantastic introduction to the field of Data Science and in this one course, you will be equipped to handle most of the common Data wrangling, processing, and analysis tasks.
You will also be introduced to a variety of tools (tech stack) that are common in the industry, and we hope you use this course as a spring board to launch your interest in Data Science!
My philosophy on Grading
Brace yourselves…
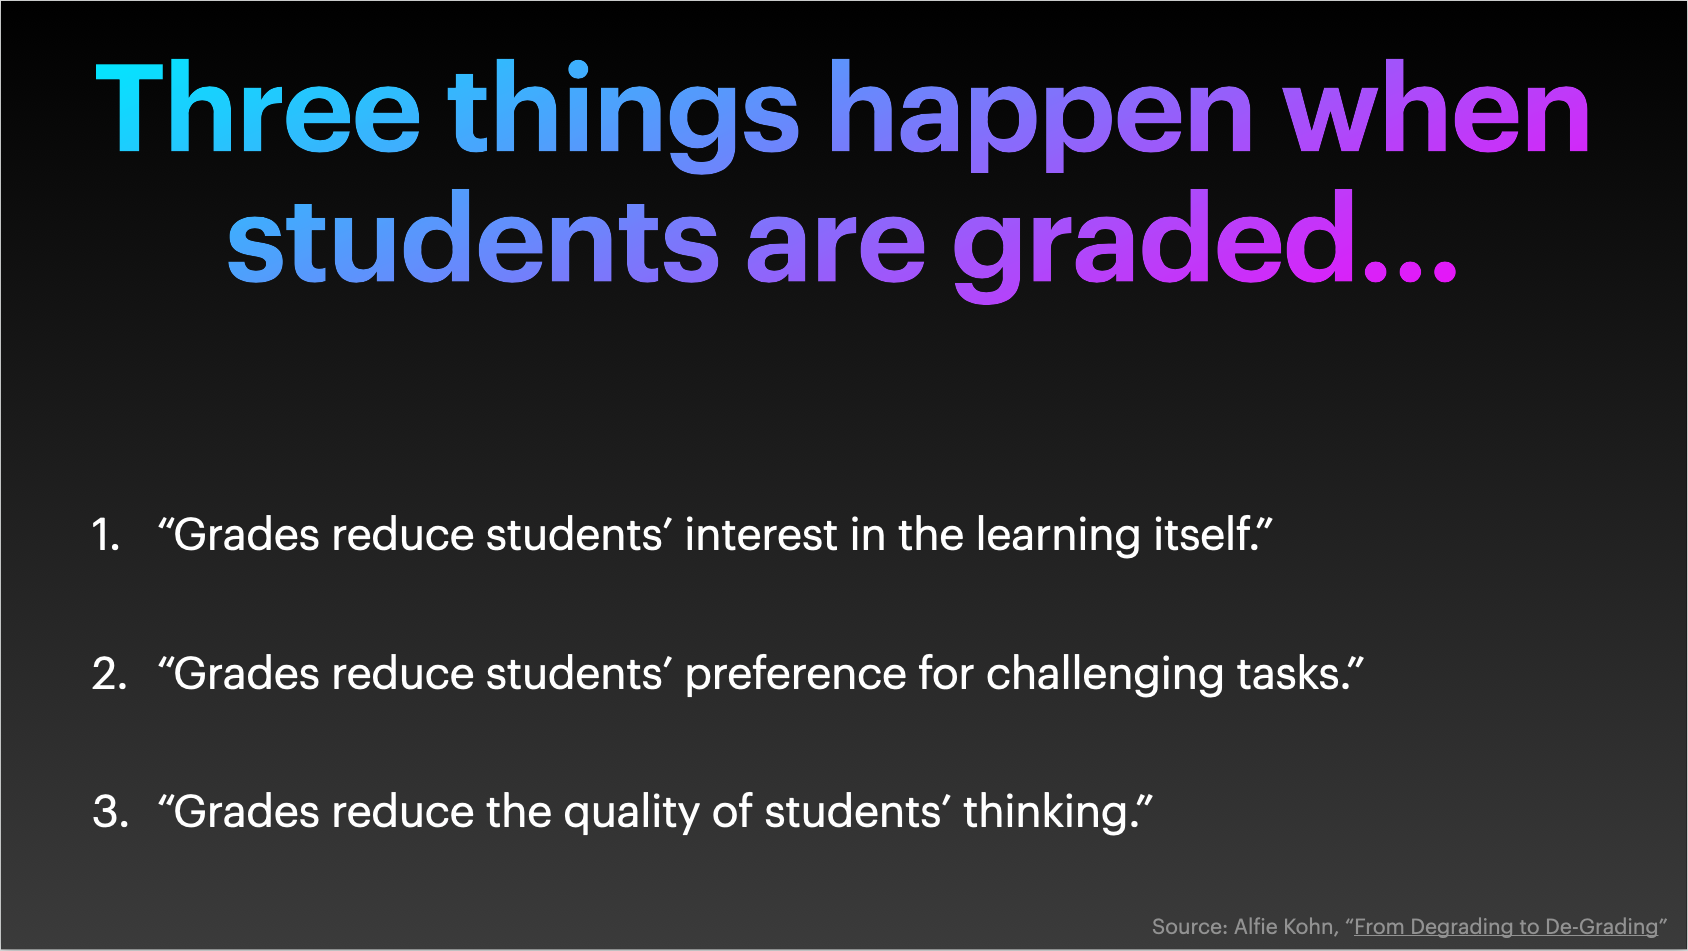
Source: Alfie Kohn, “From Degrading to De-Grading”
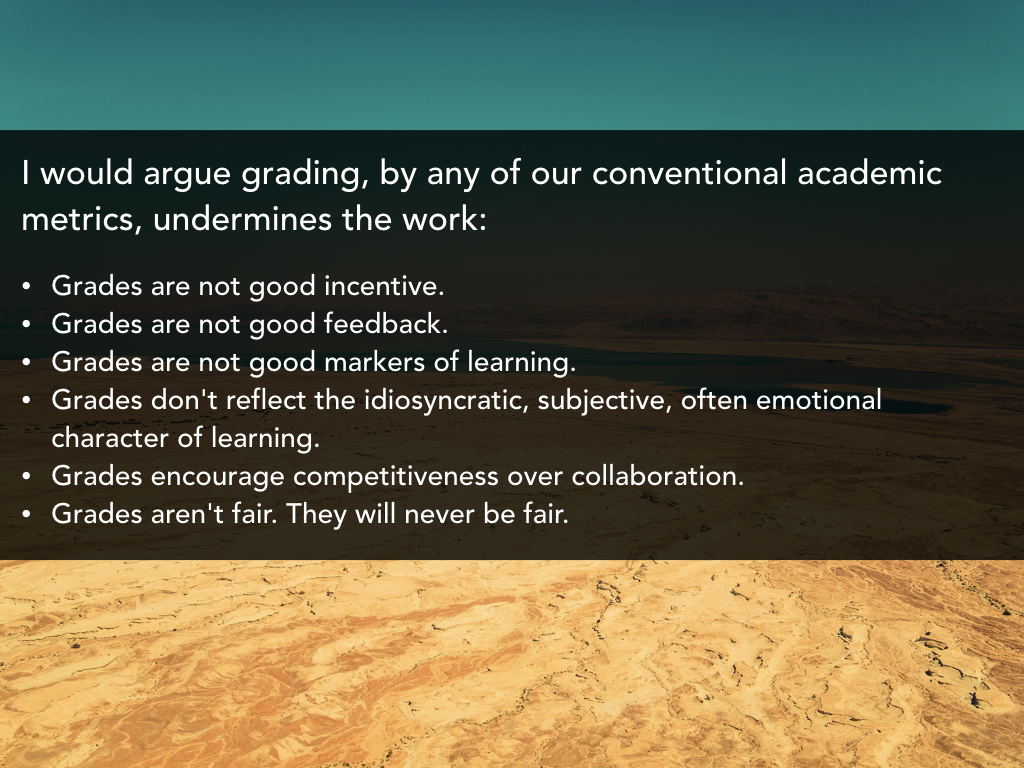
Source: Jesse Stommel, “Why I don’t Grade”
What we are doing about this in this course
You will receive LOTS of feedback on how things are going…
Do not be scared, and do not panic!
Focus on the learning; most people that put the work in will do quite well in this course
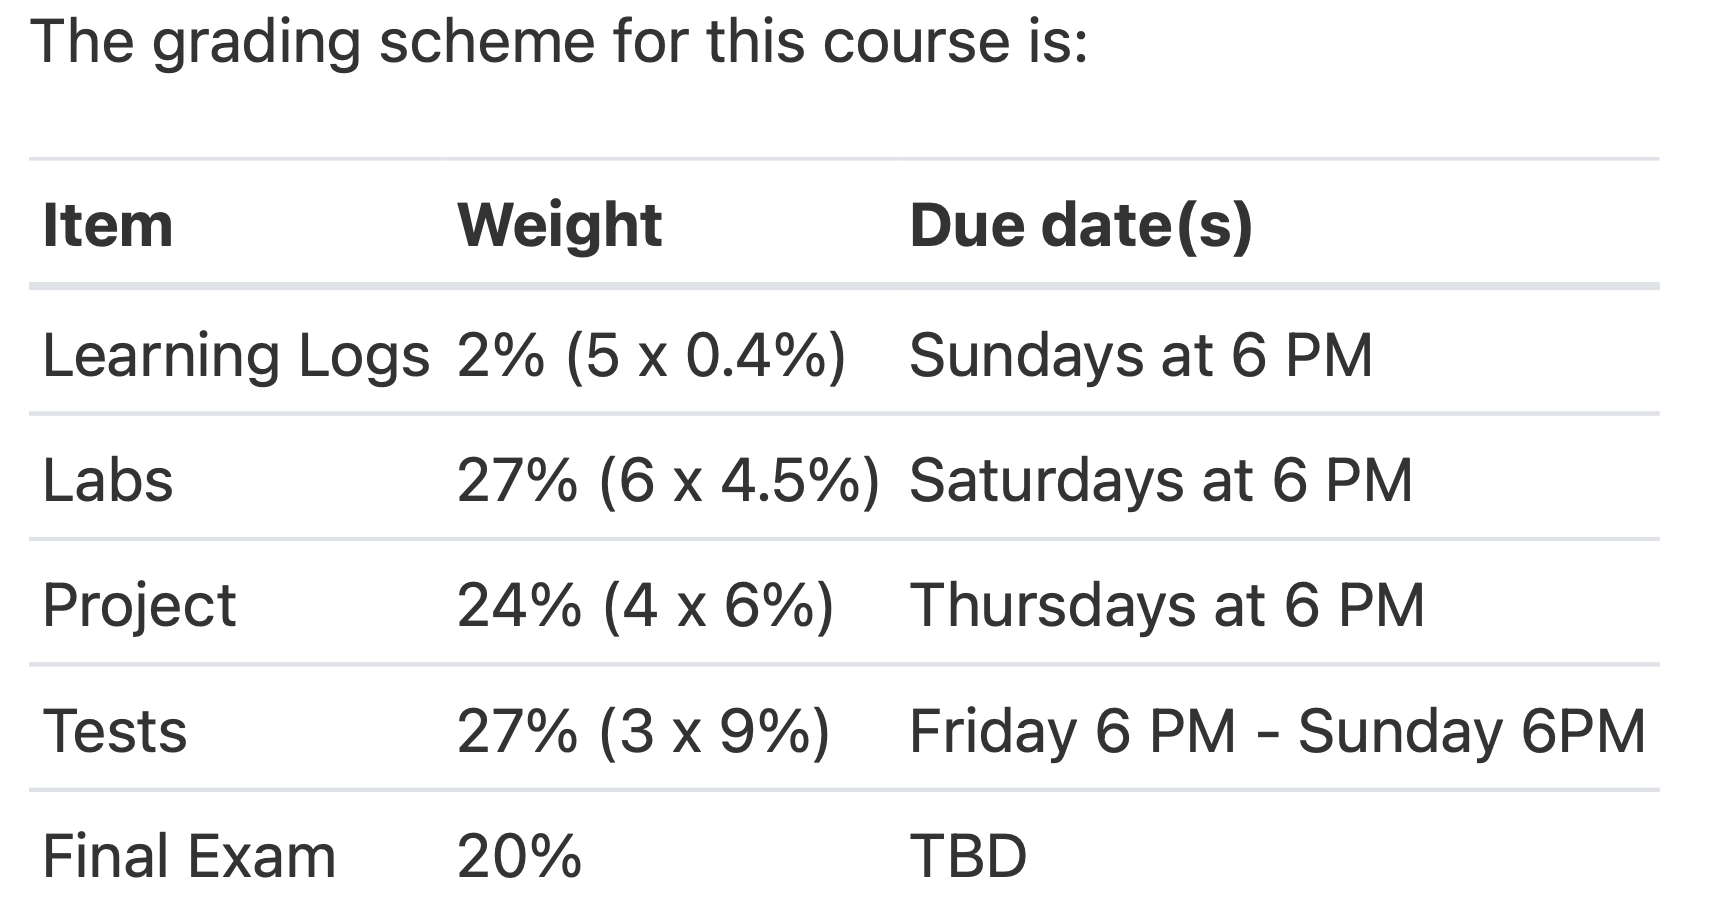
For each lab, I will ask you to submit what your deserved grade is.
Each week, I will ask you to to submit what your deserved grade is for everything in that week, as well as some justification.
You are the best judge of how much you’re learning!
Try to avoid doing a “weighted averaging” of any grades you received in this course
I reserve the right to use your grades as-is, or adjust it as needed
The Gradebook for this course will be de-emphasized…
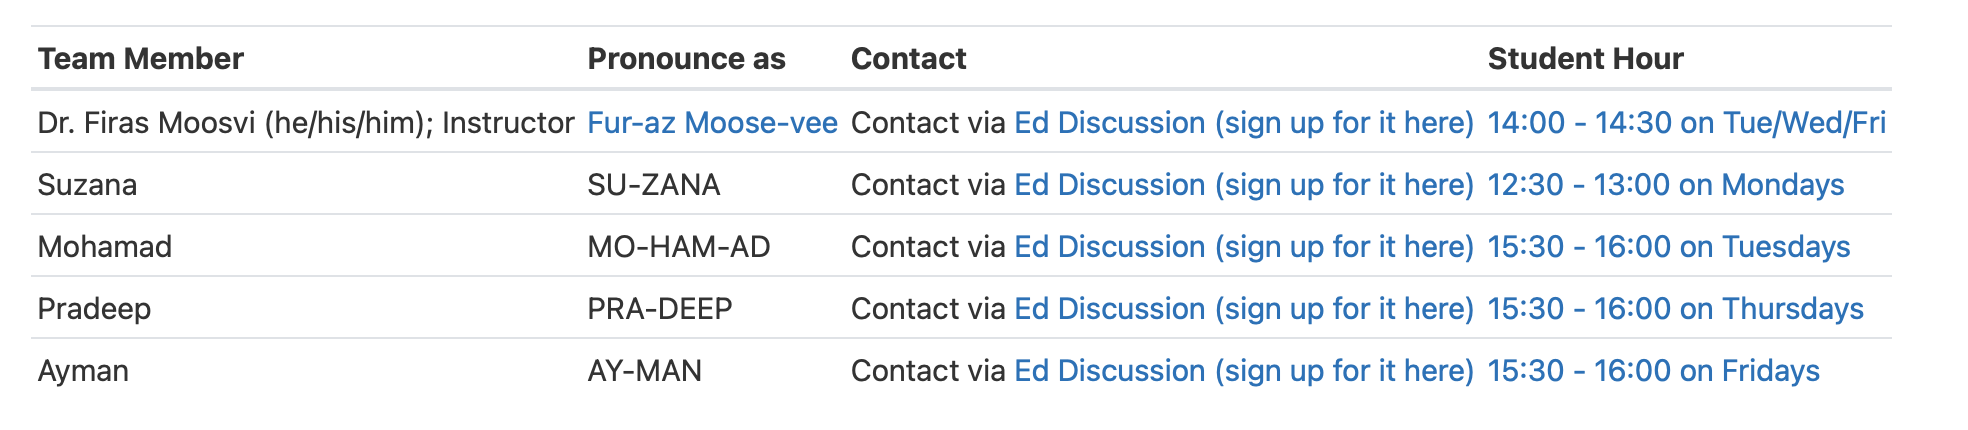
Teaching Team
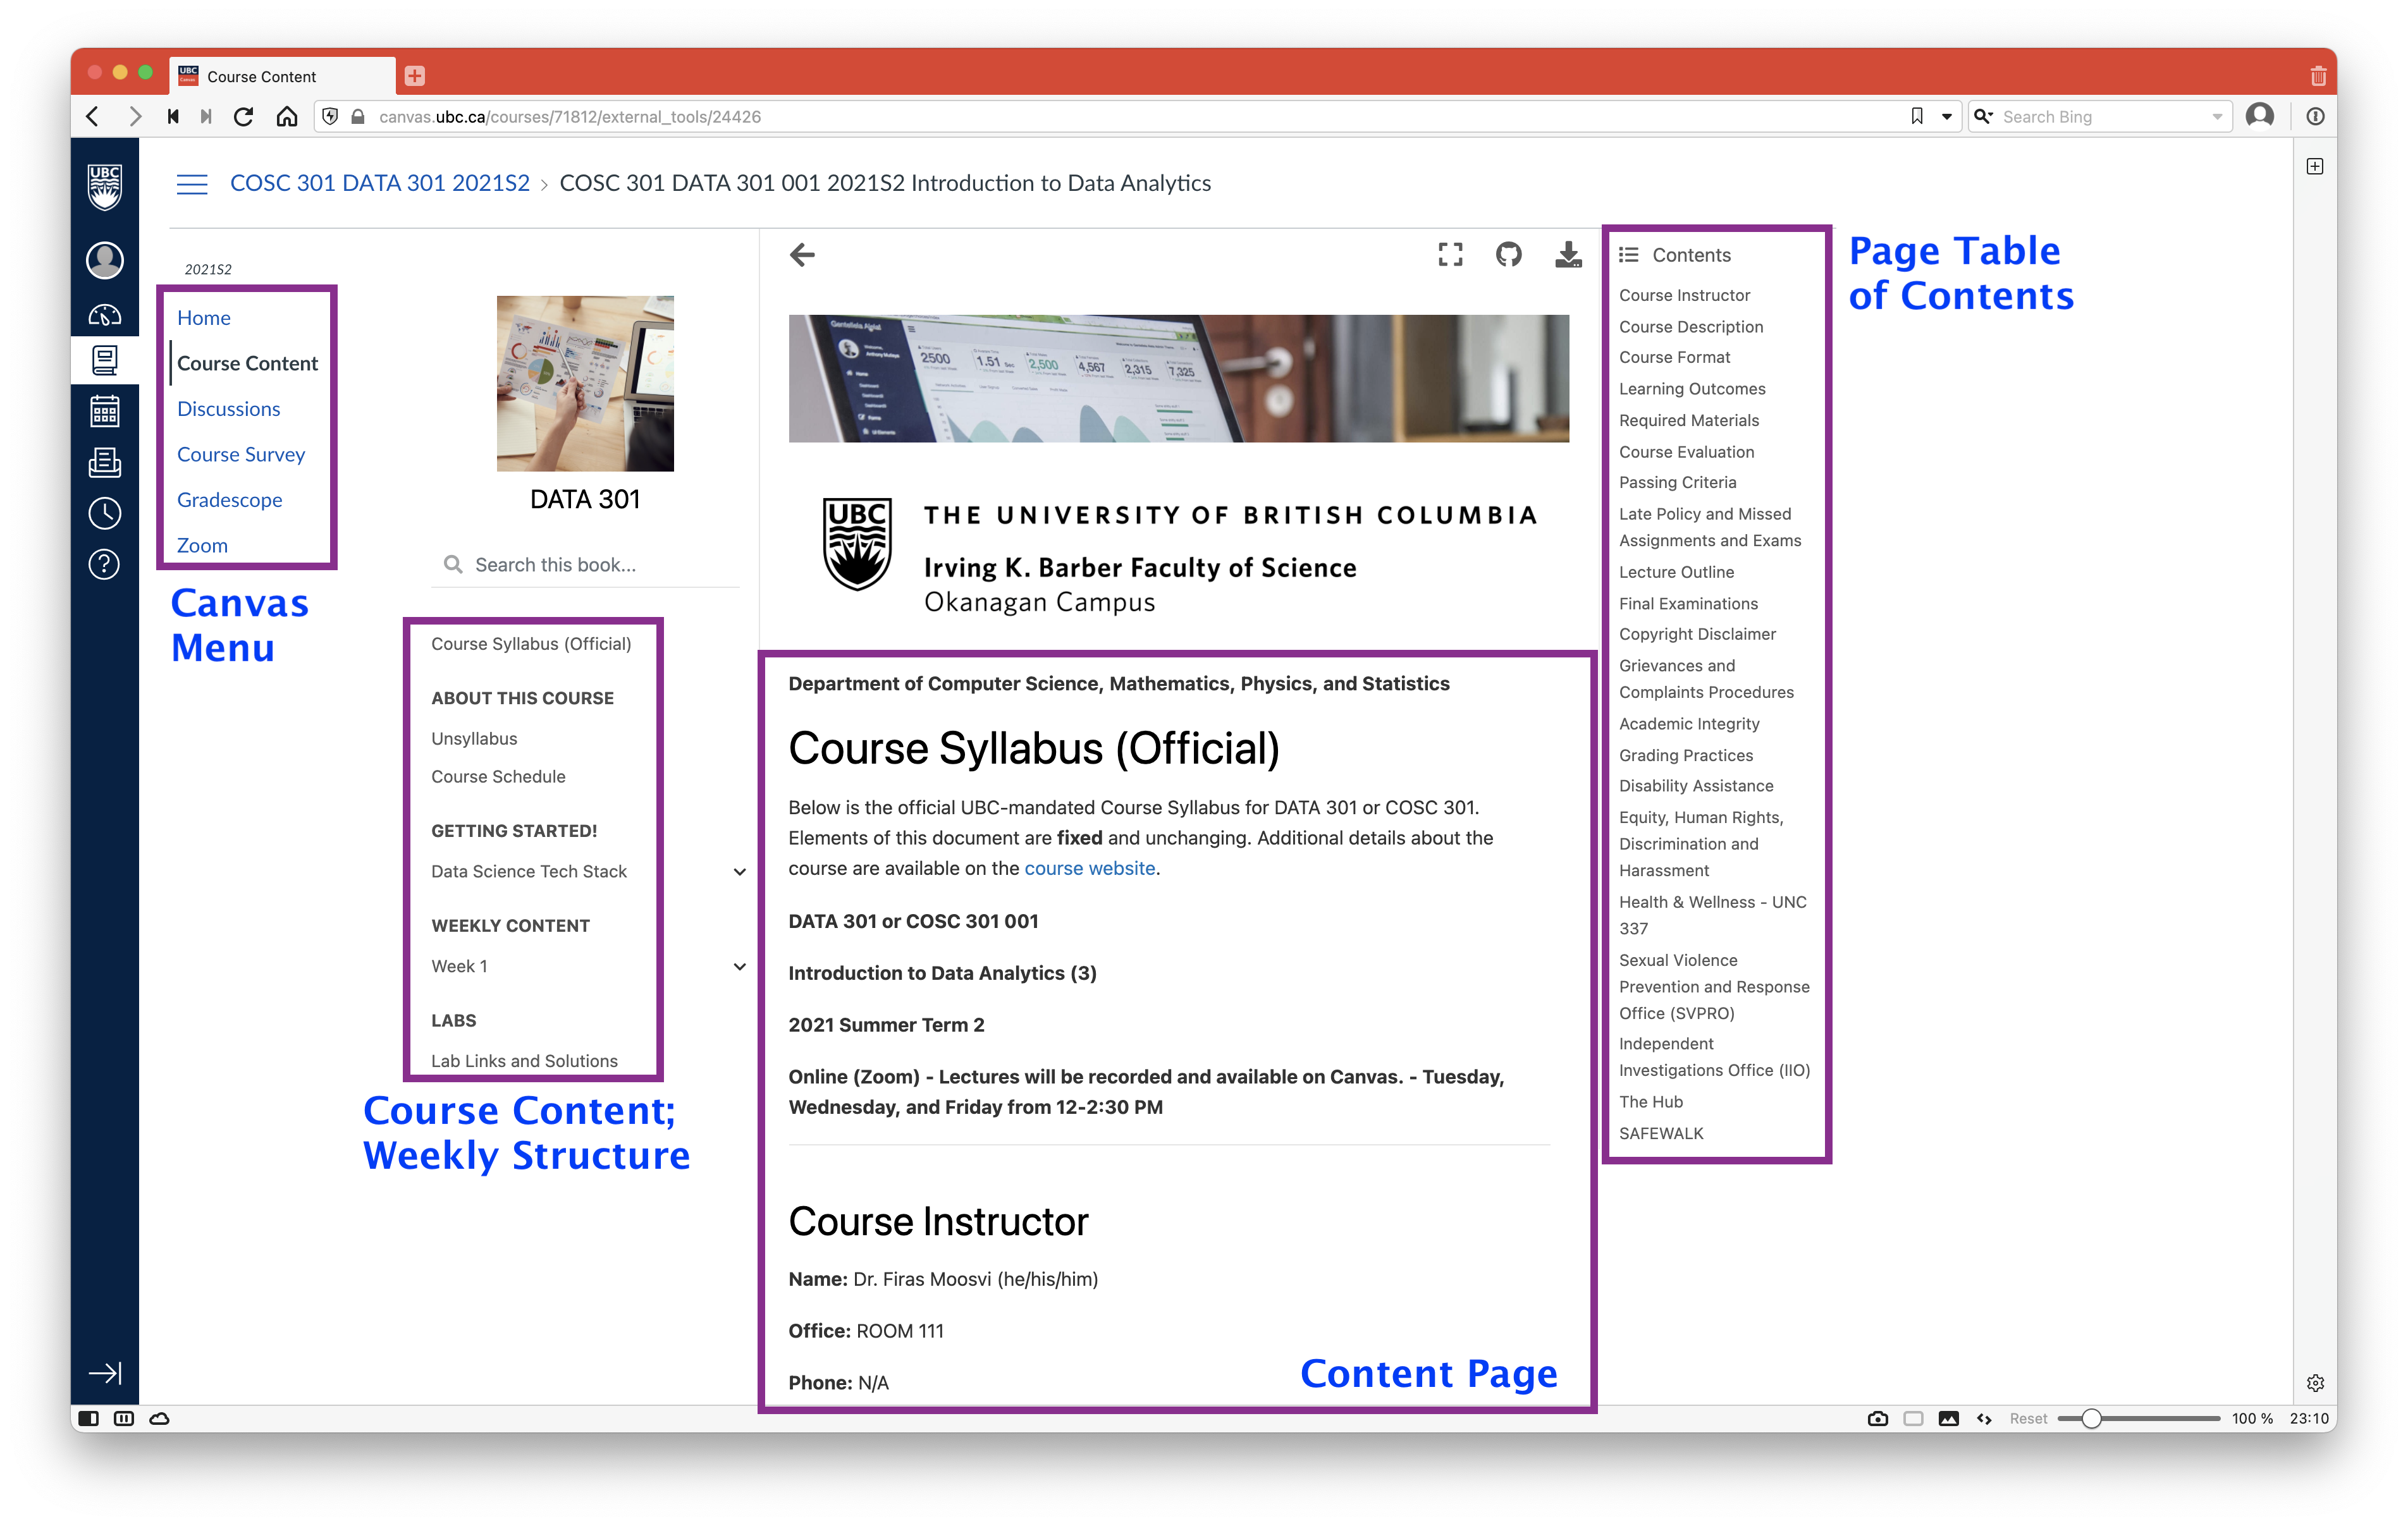
Course Website
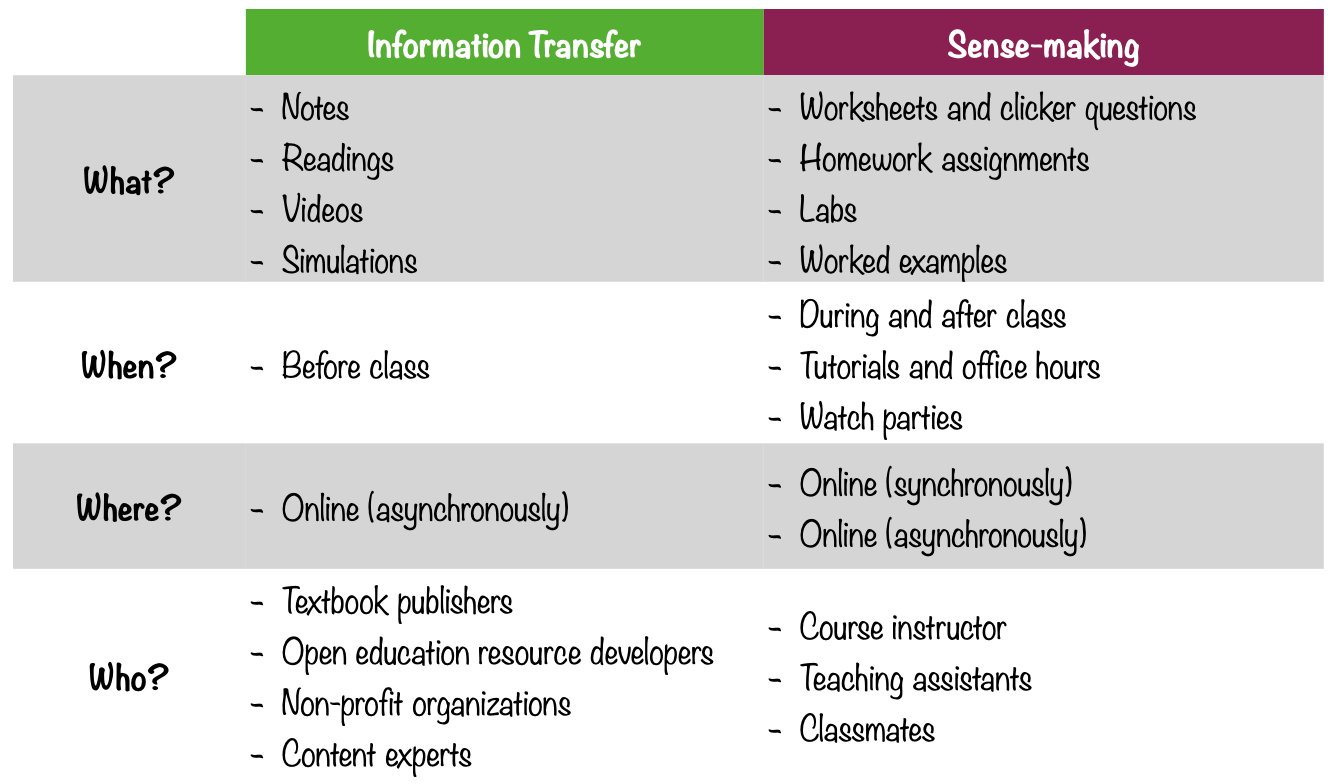
Research on Learning
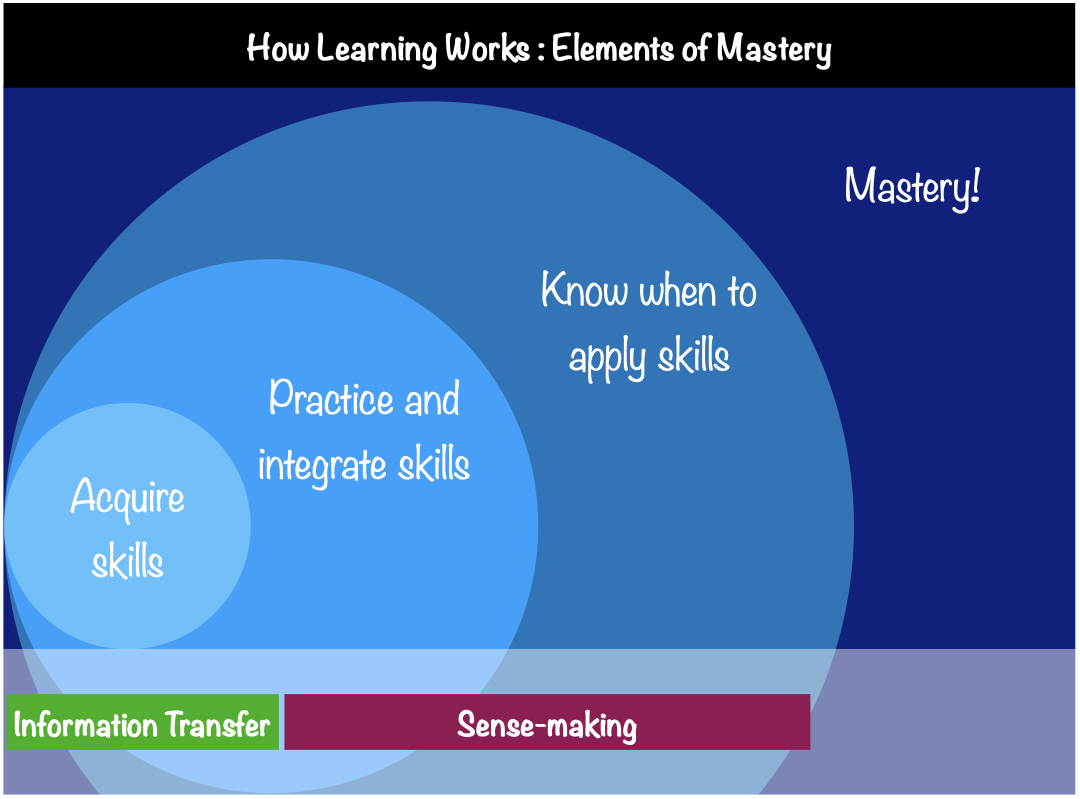
Learning in this course
Course features
48 hour grace-period on all due dates and deadlines.
Lab attendance is not mandatory (attend any and all sections that work for you).
Classes are recorded
Many opportunities to demonstrate your learning.
Long testing window so you can start the tests whenever you’re comfortable.
Weekly learning logs and reflections to make you think about your learning (metacognition).
Each test has a “bonus test” available one week later; for each test, we will take the better score of the pair.
No high-stakes exams (the single largest assessment item is the final exam).
All course assessments are completely open book, open notes, and open web (except for cheating websites like Chegg, CourseHero, Slader, Bartleby, etc…)
Plenty of TA and instructor student hours and several outside of normal business hours.
Class website that outlines exactly what you should do when to help you manage your time.
Tonnes of supplemental materials including other - instructional videos in case you want a different perspective.
Weekly prompt to accept the integrity pledge to keep you accountable.
A true willingness from the instructor (me) to help you learn and succeed in this course!
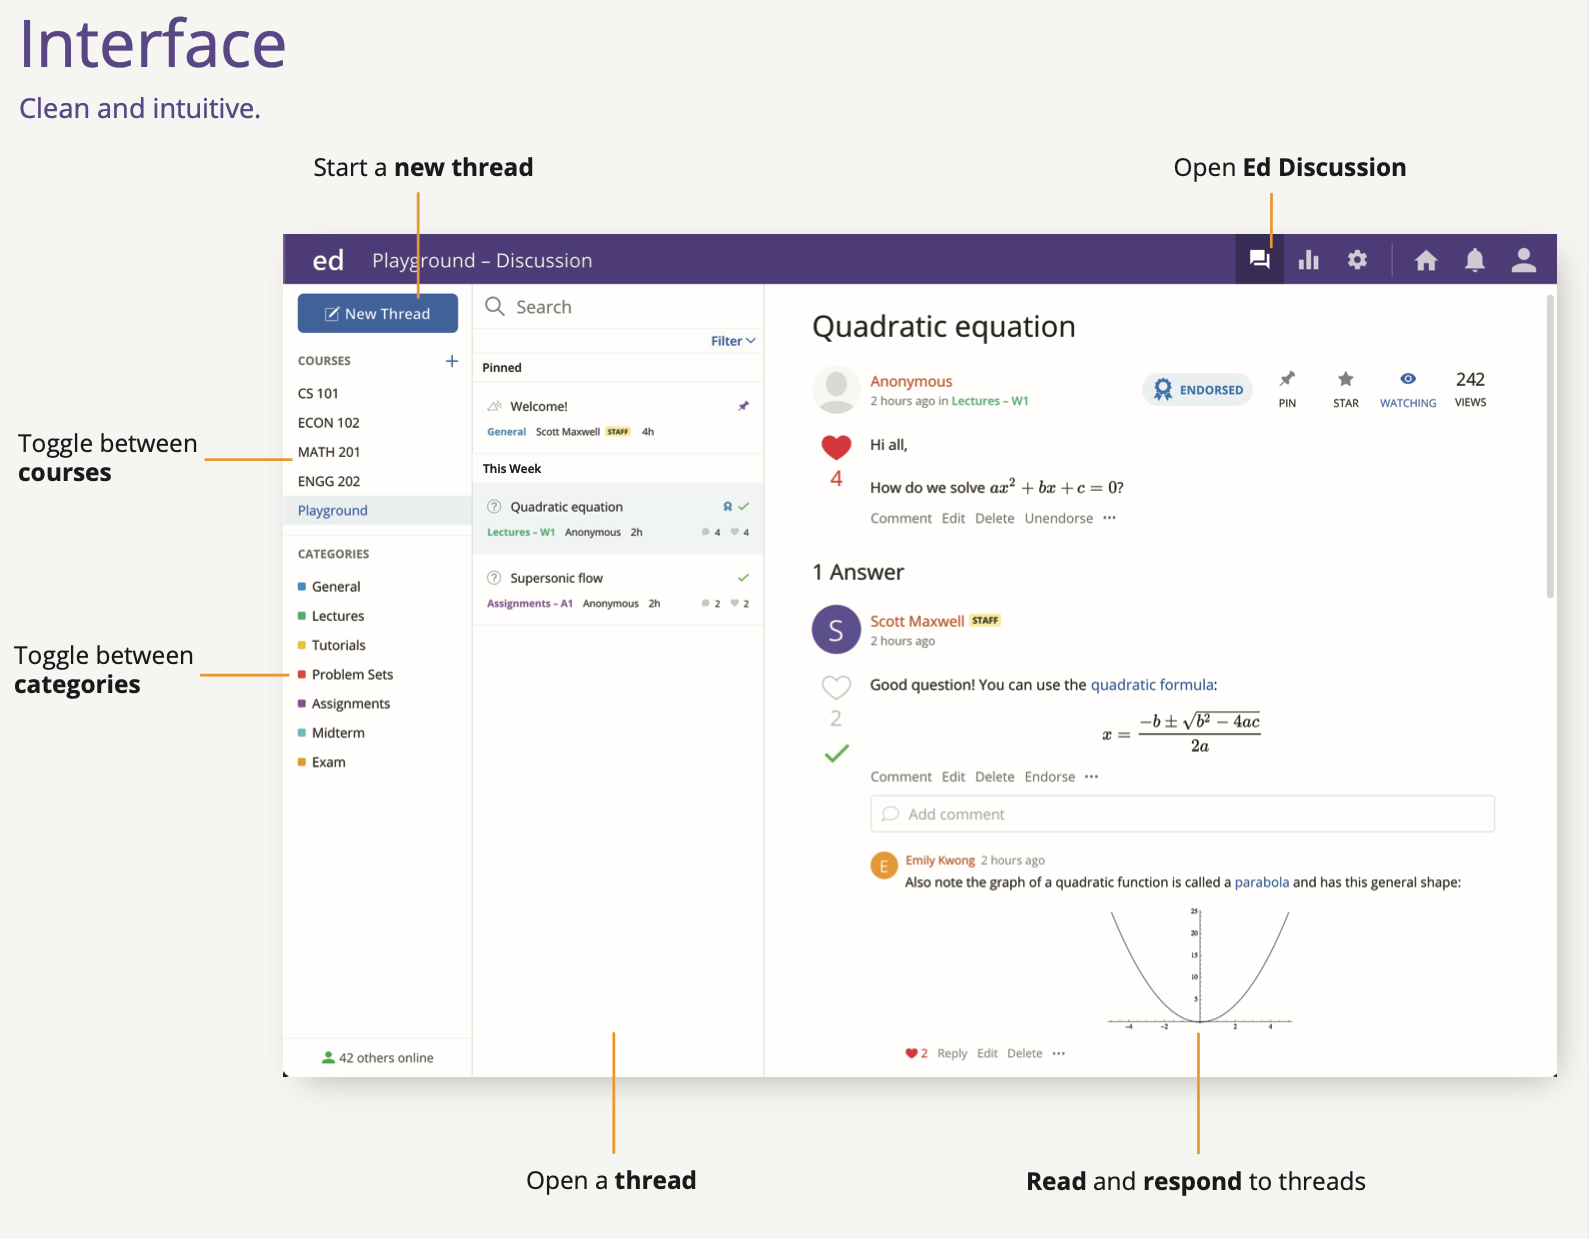
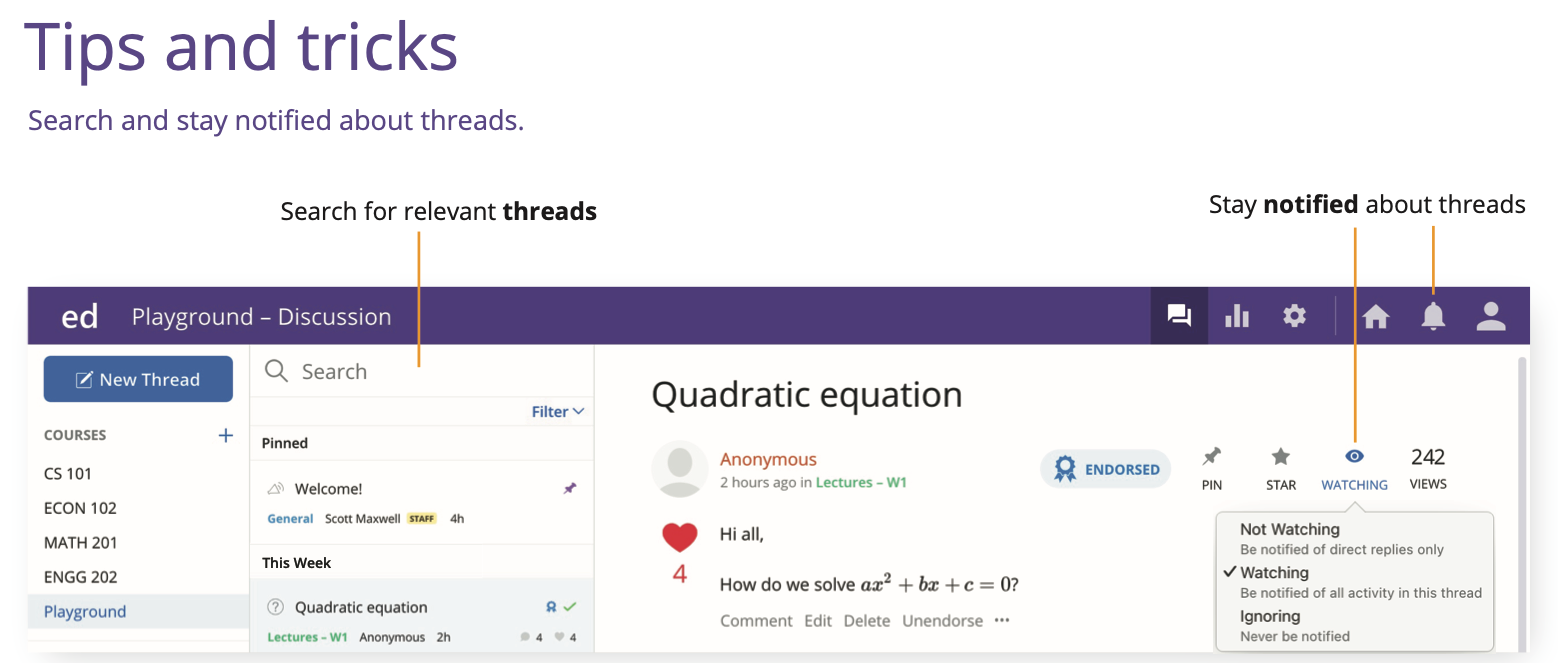
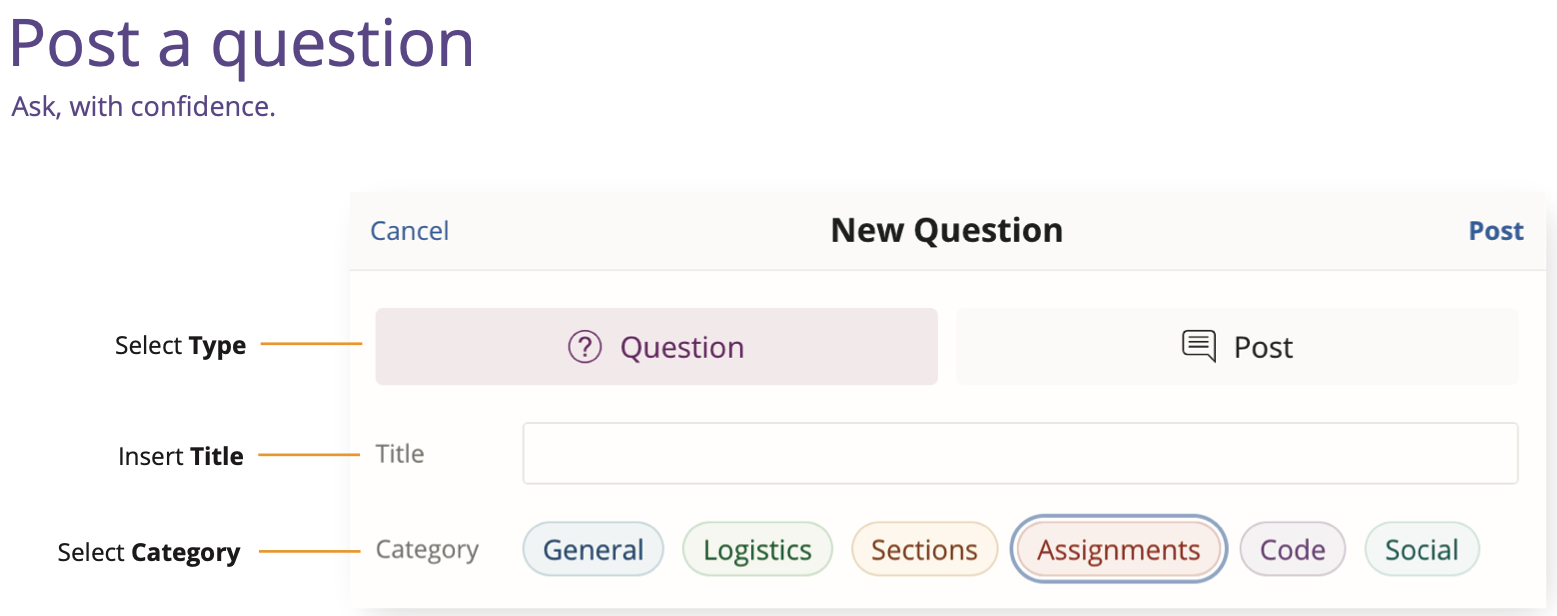
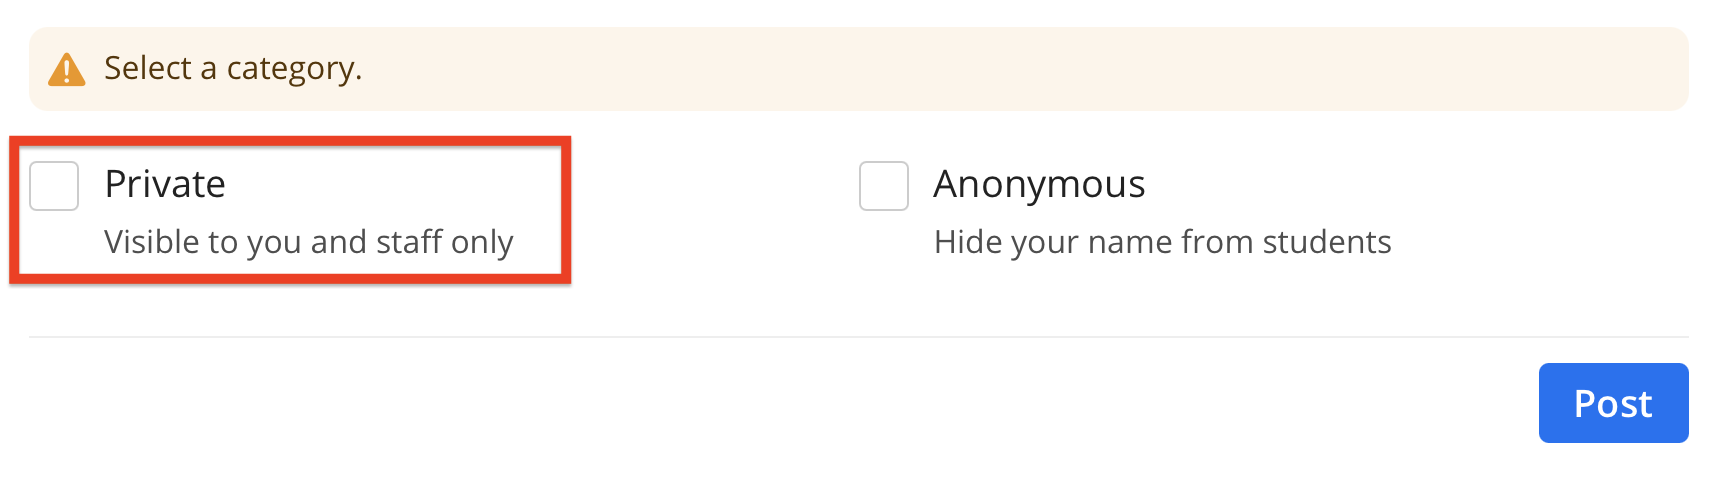
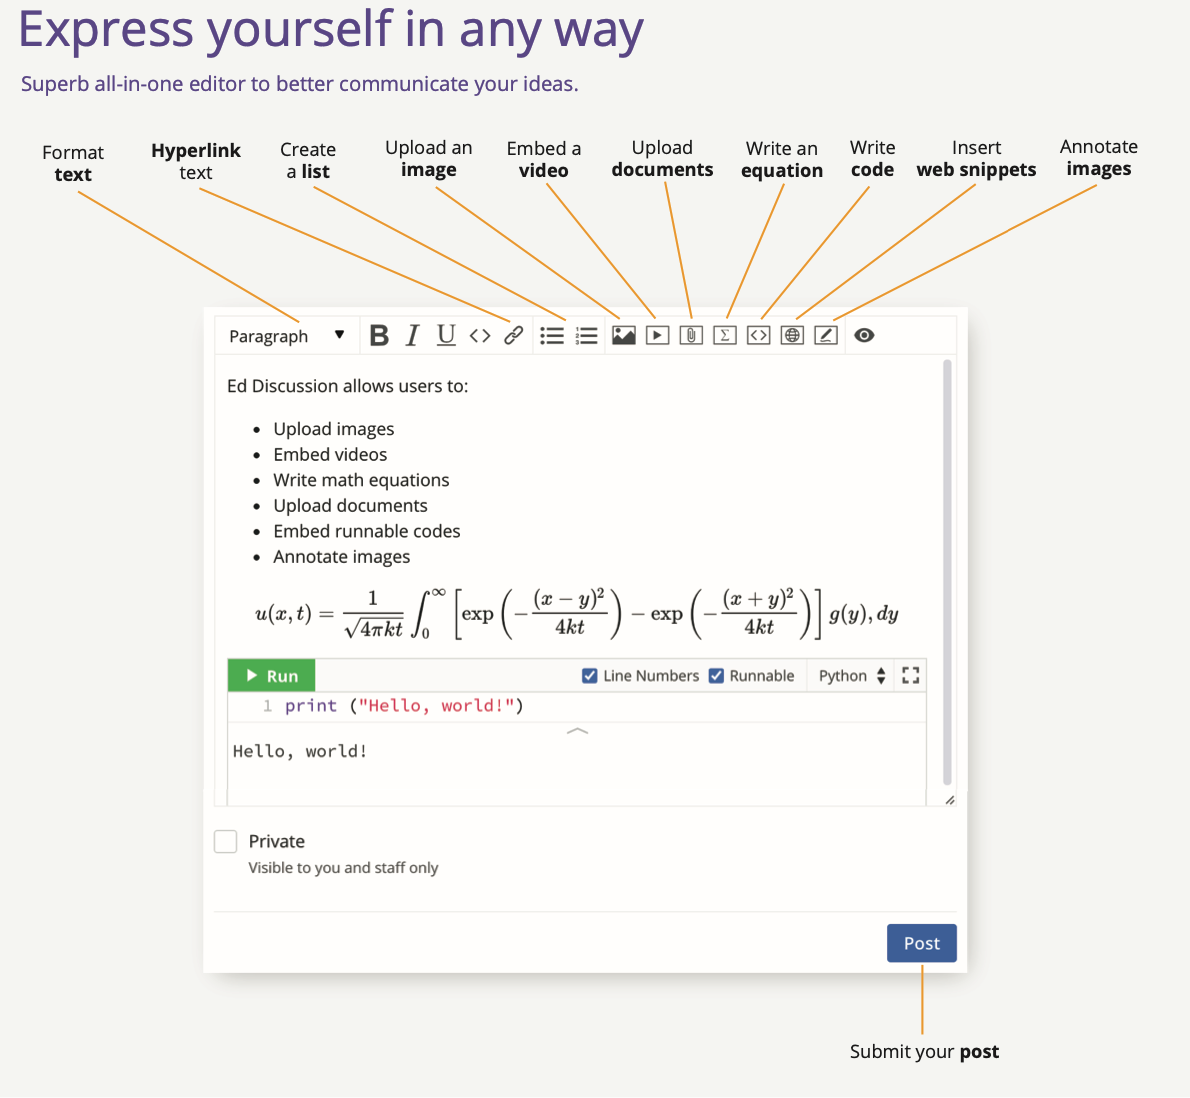
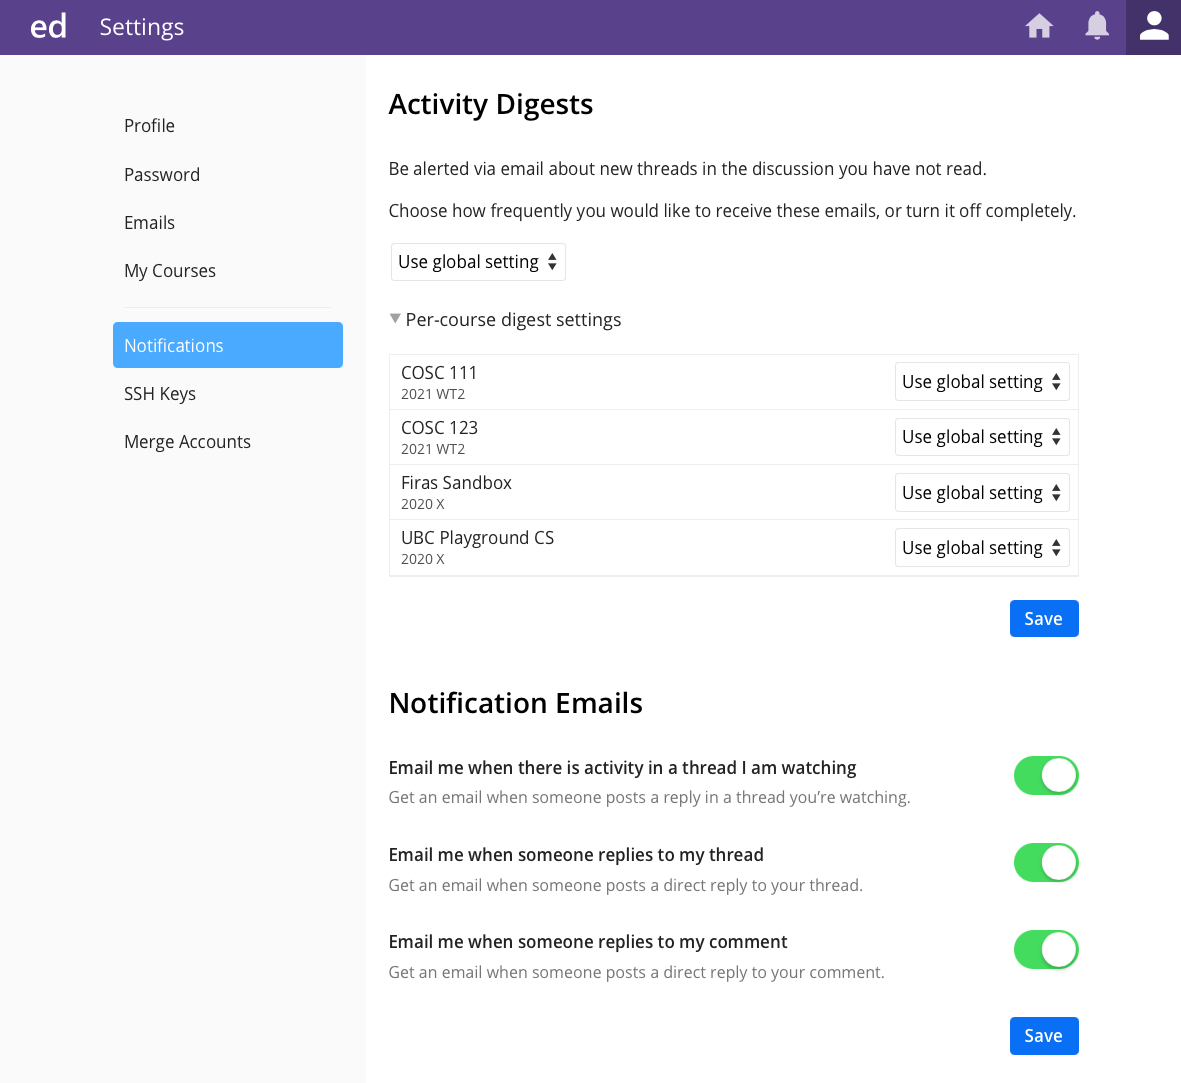
Introduction to Ed Discussion
To manage student support requests and help everyone as efficiently as possible, we will be using Ed Discussion.
This is a tool being piloted at UBC and we’re on the cutting edge!
It is essential that you get on Ed Discussion ASAP!
I will not be able to answer student emails or Canvas messages
If you email me accidentally, that’s okay! I have set up a script that auto-replies reminding you to post on Ed Discussion :-)
Introduction to Gradescope
In a course like this, it is essential for us to have a smooth process to deliver feedback to you as quickly and efficiently as possible.
Why are we using Gradescope?
Tried Canvas last year, it has HUGE efficiency issues for grading.
Gradescope has GitHub integration, Canvas does not.
Gradescope is better for providing feedback to students.
Students don’t seem to mind it 🤷🏽♂️.
Introduction to GitHub
GitHub and version control is core to this course, and to Data Science. We will be using it all term long.
GitHub 101
For now, the only commands you need to use are:
git clone <url>
git add .
git commit -m "A sample message describing your change."
git push
git pull
More to come next week…
Why are we using GitHub and GitHub Classroom?
Regardless of what programming language someone is using in Data Science (R, Python, something else), version control with Git is probably the most essential tool!
Students want to learn GitHub early in the programs and practice it throughout undergrad.
Git and GitHub is useful for other parts of your life also!
My goal is to equip you with the tools that I think you will need to be successful, GitHub is definitely one of them!
That’s it!
See you Tomorrow!