Catch-up session
Outline
Seaborn: moving a legend in a plot
Python functions Primer
Calling and using Python functions
Hard-coding stuff in a python function
Seaborn and matplotlib (Lab3B HA question)
Importing functions in a module
import pandas as pd
import seaborn as sns
import numpy as np
import matplotlib.pyplot as plt

sns.set(font_scale=1.4)
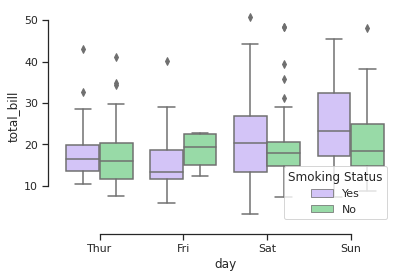
Seaborn - moving a legend
sns.set_theme(style="ticks", palette="pastel")

# Load the example tips dataset
tips = sns.load_dataset("tips")

# Draw a nested boxplot to show bills by day and time
sns.boxplot(x="day", y="total_bill",
            hue="smoker", palette=["m", "g"],
            data=tips)
sns.despine(offset=10, trim=True)
plt.legend(loc='lower right',title='Smoking Status')

# Source: https://seaborn.pydata.org/examples/grouped_boxplot.html
<matplotlib.legend.Legend at 0x7efdfc33e700>
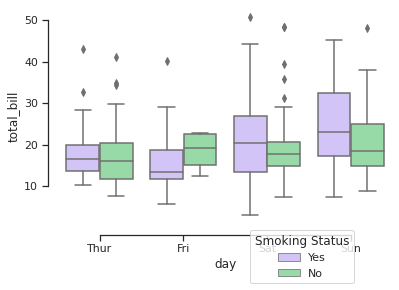
Put legend outside plot
# Draw a nested boxplot to show bills by day and time
sns.boxplot(x="day", y="total_bill",
            hue="smoker", palette=["m", "g"],
            data=tips)
sns.despine(offset=10, trim=True)
plt.legend(bbox_to_anchor=(0.9,0),
           title='Smoking Status')

# Source: https://seaborn.pydata.org/examples/grouped_boxplot.html
# Legend position Source: https://www.statology.org/seaborn-legend-position/
<matplotlib.legend.Legend at 0x7efdb858e8e0>
Python Functions - Primer
syntax of creating a python function
“how to create your own .py file”
Arguments
# syntax of creating a python function

def magic_firas(num, print_evens = True):
    for i in range(num):
        if print_evens==True and i%2==0:
            print(i)
        elif i%2!=0:
            print(i)

# the function above, replaces all these functions below
# def magic_firas_5():
#     for i in range(5):
#         print(i)

# def magic_firas_6():
#     for i in range(6):
#         print(i)
magic_firas(num=20, print_evens = False)
1
3
5
7
9
11
13
15
17
19
# Remember to use the parameters that you ask for in a function definition

def load_and_process(path,encoding_input='ISO-5592'):
    # pd.read_csv('~/data301/project_repo/data/raw/test.csv') # This is wrong!!! Don't do this!
    pd.read_csv(path, encoding = encoding_input)
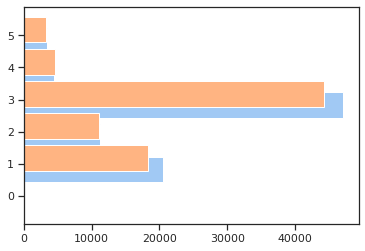
plt.barh from Lab 3
Using set() data type, find the all the different regions in df[‘HA’]. In the next step, calculate the count of all cases in each of those regions. Finally, using plt.barh, plot a horizontal bar chart of number of cases based on their regions.
Hint: More information and examples can be find in link
Hint: Your plot doesn’t have to look exactly like this, but please do explore the possible color palettes. You can specify the colour palette by passing in the keyword like this: palette=’colorblind’.
# load the data
df = pd.read_csv('http://www.bccdc.ca/Health-Info-Site/Documents/BCCDC_COVID19_Dashboard_Case_Details.csv')
df.head()
| Reported_Date | HA | Sex | Age_Group | Classification_Reported | |
|---|---|---|---|---|---|
| 0 | 2020-01-29 | Out of Canada | M | 40-49 | Lab-diagnosed |
| 1 | 2020-02-06 | Vancouver Coastal | F | 50-59 | Lab-diagnosed |
| 2 | 2020-02-10 | Out of Canada | F | 20-29 | Lab-diagnosed |
| 3 | 2020-02-10 | Out of Canada | M | 30-39 | Lab-diagnosed |
| 4 | 2020-02-18 | Interior | F | 30-39 | Lab-diagnosed |
ha = list(df['HA'].unique())
ha
['Out of Canada',
 'Vancouver Coastal',
 'Interior',
 'Fraser',
 'Northern',
 'Vancouver Island']
len(df[(df['HA']==ha[0]) & (df['Sex']=='M')])
196
ha_M = []
ha_F = []

for h in ha:
    print(h)
    ha_M.append(len(df[(df['HA']== h) & (df['Sex']=='M')]))
    ha_F.append(len(df[(df['HA']== h) & (df['Sex']=='F')]))
Out of Canada
Vancouver Coastal
Interior
Fraser
Northern
Vancouver Island
ha
['Out of Canada',
 'Vancouver Coastal',
 'Interior',
 'Fraser',
 'Northern',
 'Vancouver Island']
ha_M
[196, 20454, 11167, 46963, 4501, 3447]
ha_F
[29, 18283, 11124, 44208, 4548, 3211]
y = np.arange(len(ha)) # Locations of health authorities
width = 0.35

fig, ax = plt.subplots()

ax.barh(y - width/2, ha_M,label='M')
ax.barh(y + width/2, ha_F,label='F')
ax.set_yticks(x)
ax.set_yticklabels(ha)
plt.legend()
sns.despine()
plt.title('This is a nice title')
# source: https://matplotlib.org/stable/gallery/lines_bars_and_markers/barchart.html
---------------------------------------------------------------------------
NameError                                 Traceback (most recent call last)
/tmp/ipykernel_2011/703531648.py in <module>
      6 ax.barh(y - width/2, ha_M,label='M')
      7 ax.barh(y + width/2, ha_F,label='F')
----> 8 ax.set_yticks(x)
      9 ax.set_yticklabels(ha)
     10 plt.legend()

NameError: name 'x' is not defined
df['HA'].value_counts().index
Index(['Fraser', 'Vancouver Coastal', 'Interior', 'Northern',
       'Vancouver Island', 'Out of Canada'],
      dtype='object')
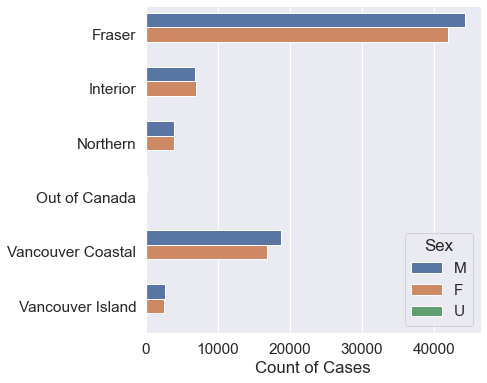
fig, ax = plt.subplots(figsize=(6,6)) # how to change the figure size
sns.countplot(data=df,y='HA',hue='Sex', order = sorted(ha))
plt.xlabel('Count of Cases')
plt.ylabel('')
sns.despine()
Importing functions from a module
Explanation of this: https://github.com/firasm/demo_project_imports