DATA 530 Lab 3 - Excel Data Analysis
This lab practices using Microsoft Excel to perform analysis of business data including reporting and predictions.
Objectives
Manipulate sales data commonly seen in business applications.
Create several pivot tables and pivot charts.
Develop what-if scenarios to make it easy to communicate possibilities.
Use goal seek to determine sales targets.
Experiment with analysis toolpak.
Create a macro using the macro recorder.
Execute a recorded macro to automate a repetitive task.
Create a user-defined function in VBA using the Visual Basic Editor.
Use a user-defined function.
Analysis Problem and Goals
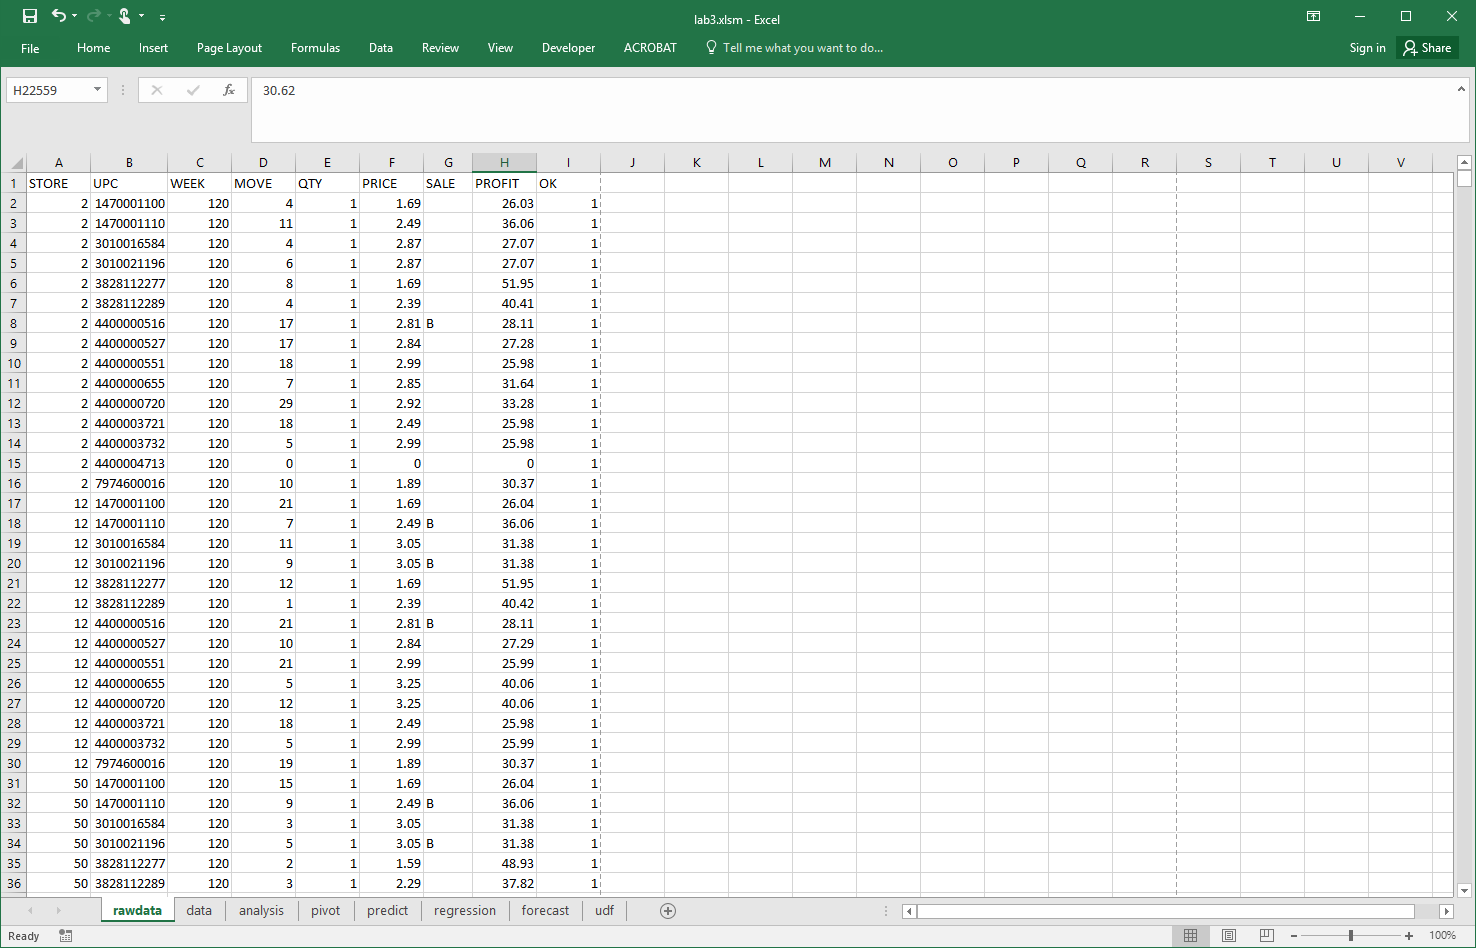
This scenario involves analyzing real-world, historical business sales data. This data set was collected by the University of Chicago from 1989 to 1997 for the company Dominick’s Finer Foods. From this large data set, we are going to perform an analysis on the store-level sales data which contains data for each UPC sold at every store on a weekly basis. The format of the data is below and a detailed description is available.
Variable |
Description |
Type |
Length |
|---|---|---|---|
upc |
UPC Number |
Numeric |
8 |
store |
Store Number |
Numeric |
3 |
week |
Week Number |
Numeric |
3 |
move |
Number of unit sold |
Numeric |
8 |
price |
Retail Price |
Numeric |
8 |
qty |
Number of item bundled together |
Numeric |
3 |
profit |
Gross margin |
Numeric |
8 |
sale |
Sale code (B, C, S) |
Character |
8 |
ok |
1 for valid date, 0 for trash |
Numeric |
3 |
Note: To calculate the gross sales, use price * move / qty. To calculate the gross profit, multiple sales by profit/100.
Click to download the data set that consists of the sales for the top 20 products from the Cookie category for 5 stores from 1992 to 1996.
Goals
The analysis goals are:
Loading - load the input CSV file into Excel and convert into an Excel spreadsheet file.
Cleaning - filter out all data indicated as “trash” (value 0) in ok field.
Summary - create pivot tables for analyzing sales and profits.
Visualization - create charts to display data from pivot tables.
Analysis - use the sales data to answer analysis questions such as most profitable items, future estimated sales, and what-if scenarios.
Marking and Evaluation
Marks are awarded by precisely following these requirements:
Loading (1 mark) - submit an Excel file called lab3.xlsm (Excel macros enabled) where the first sheet is called rawdata and contains the loaded data set with no changes.
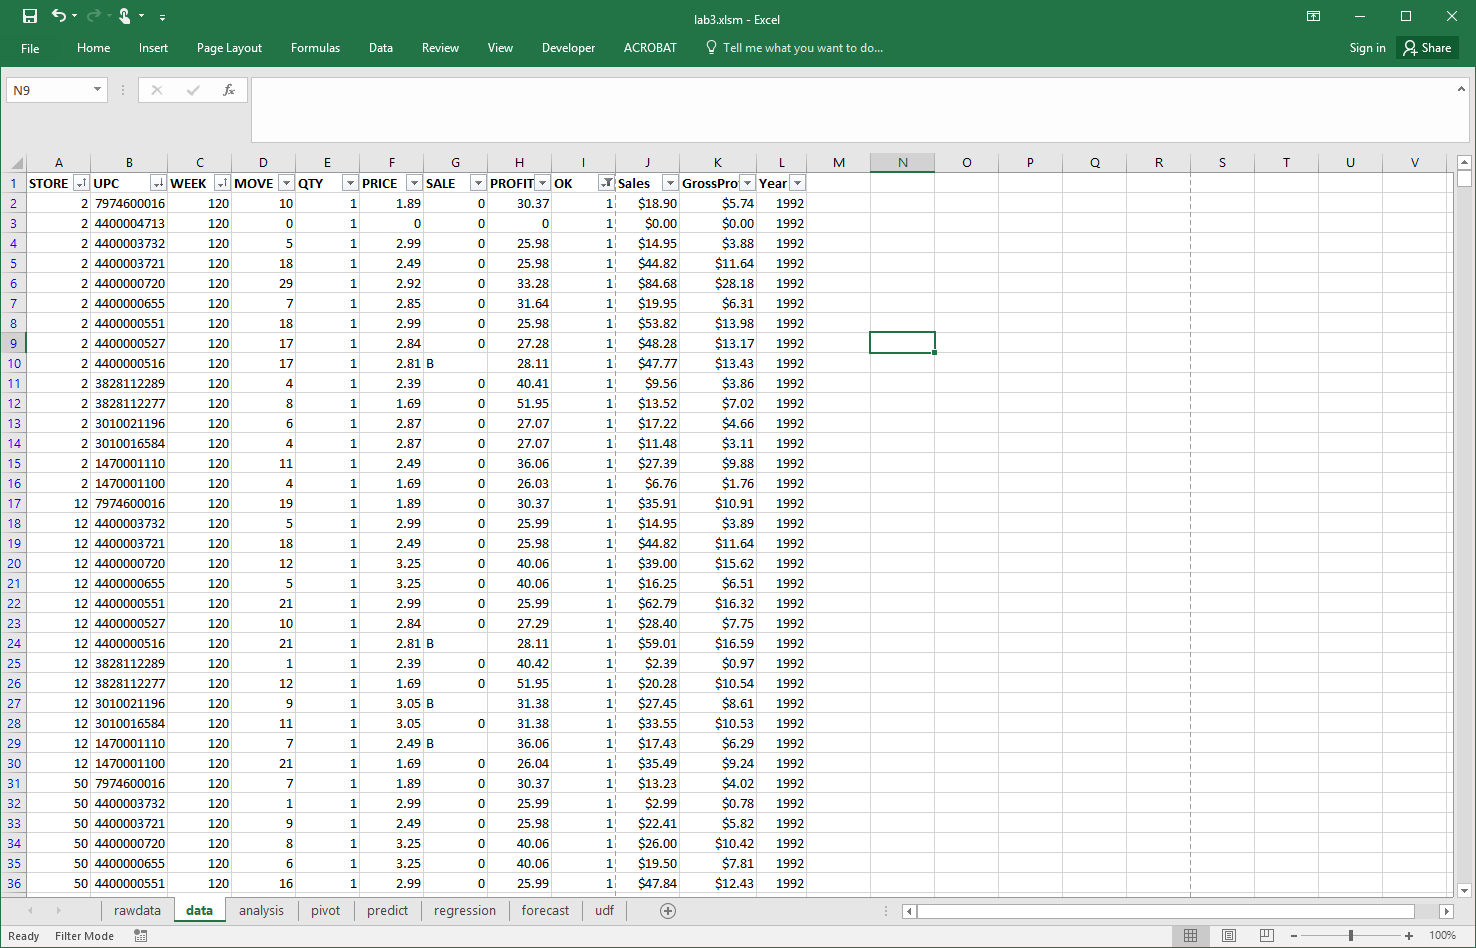
Cleaning (3 marks) - create a second sheet called data that contains the data set after the following formatting and cleaning:
Header fields must be in bold font. UPC field must display entire value (make sure column width is wide enough). (0.5 marks)
Add a column called Sales which is calculated as:
price * move / qty. Add a column called GrossProfit which is calculated as:Sales * Profit/100. Both columns must be formatted as Currency. (0.5 marks)Add a column called Year that calculates the year for each week. (1 mark)
- 1992 - Weeks 120 to 172
- 1993 - Weeks 173 to 225
- 1994 - Weeks 226 to 277
- 1995 - Weeks 278 to 329
- 1996 - Weeks 330 to 381The data must be sorted by week (ascending), then store (ascending), then UPC (descending). (0.5 marks)
Filter data so only values of
OK=1appear (no trash data). (0.5 marks)
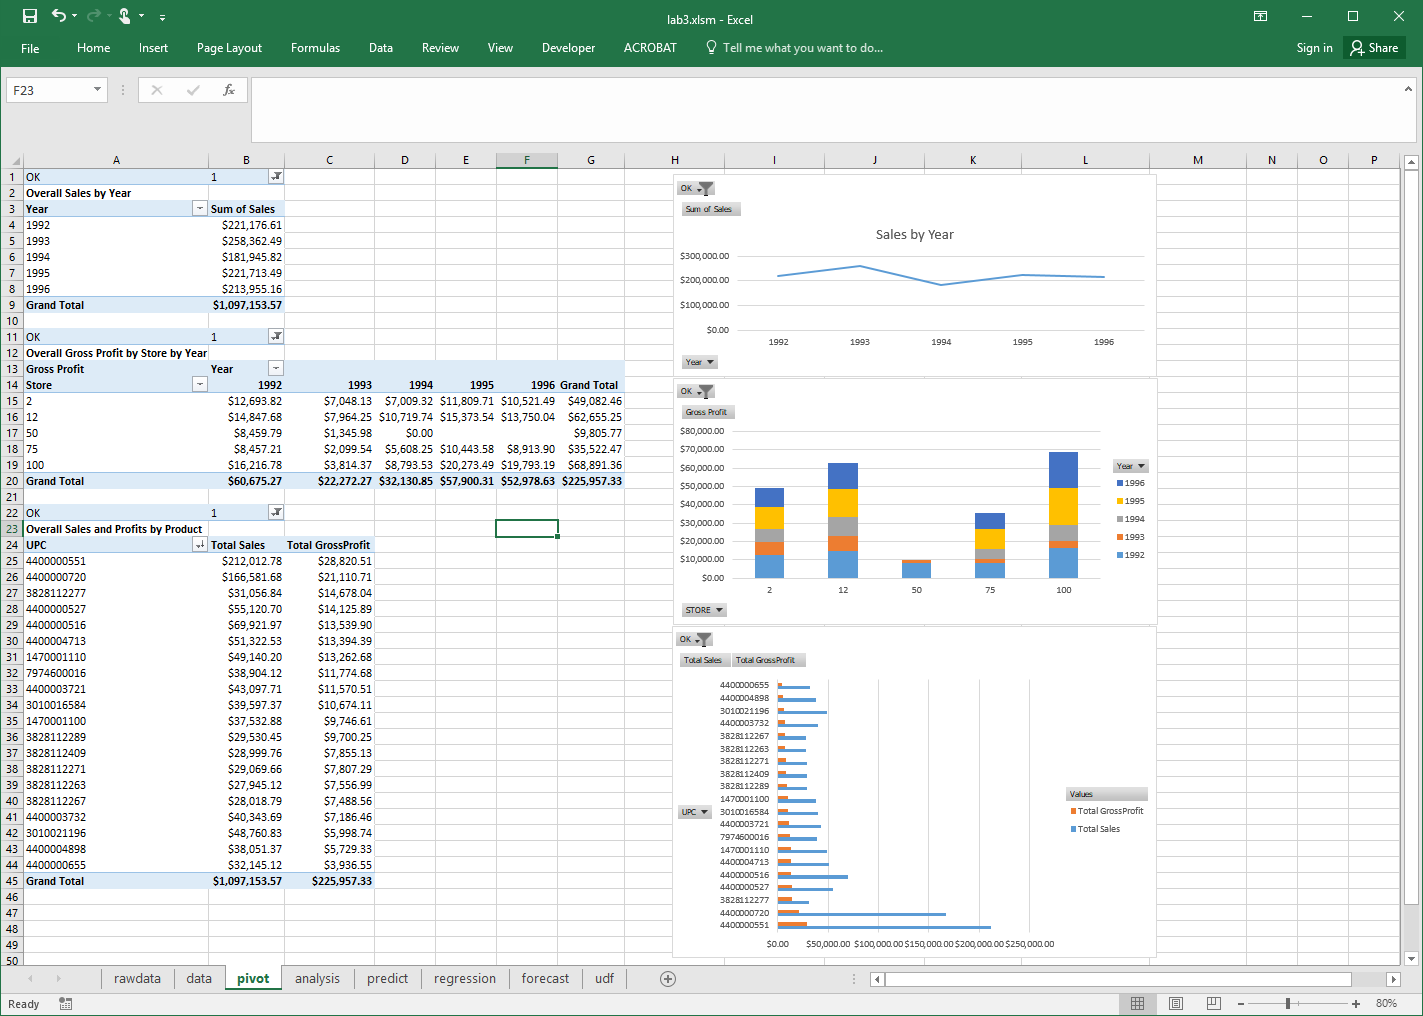
Summary Analysis and Visualization (3 marks) - create a third sheet called pivot that contains:
A pivot table for overall sales by year with a line chart. (1 mark)
A pivot table for overall gross profit by stores by year with a stacked column chart. (1 mark)
A pivot table for overall sales and profits by UPC with a clustered bar chart. Sort by total gross profit descending. (1 mark)
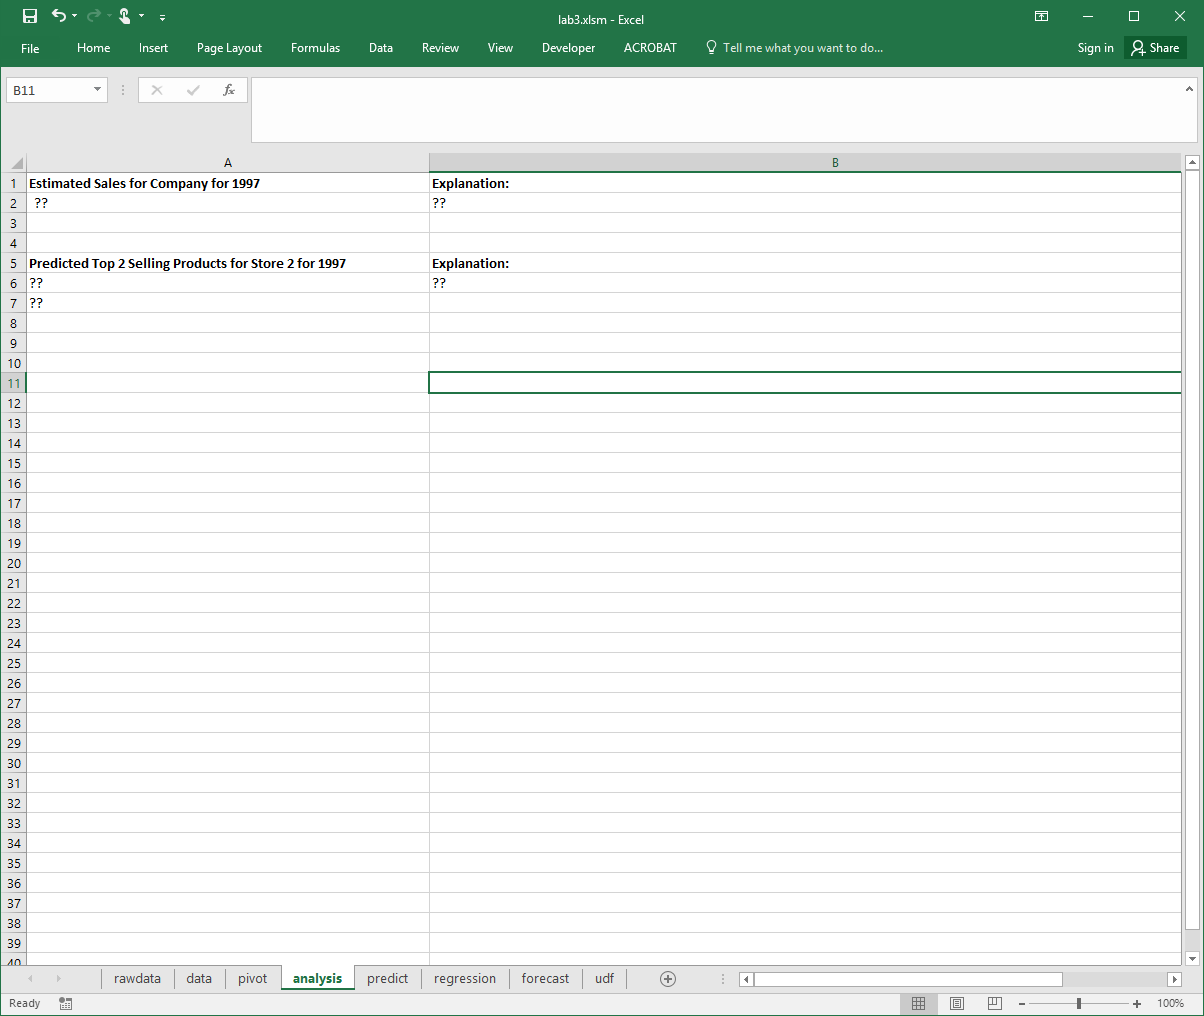
Analysis (3 marks) - create a fourth sheet called analysis that contains:
In cell A2, estimate the total sales for the company in 1997 and give a short reason in cell B2 for your estimate. (1 mark)
Based on 1996 sales, predict the top 2 selling products (by Sales) (provide UPC) for 1997 for store 2. Put UPC codes in cells A6 and A7 and an explanation in B6. (2 marks)
Note: None of these values in the analysis tab need to be calculated with formulas. You must just figure out the right answer and type it in as a value in the cell.
Predictions (3 marks) - create a fifth sheet called predict that contains:
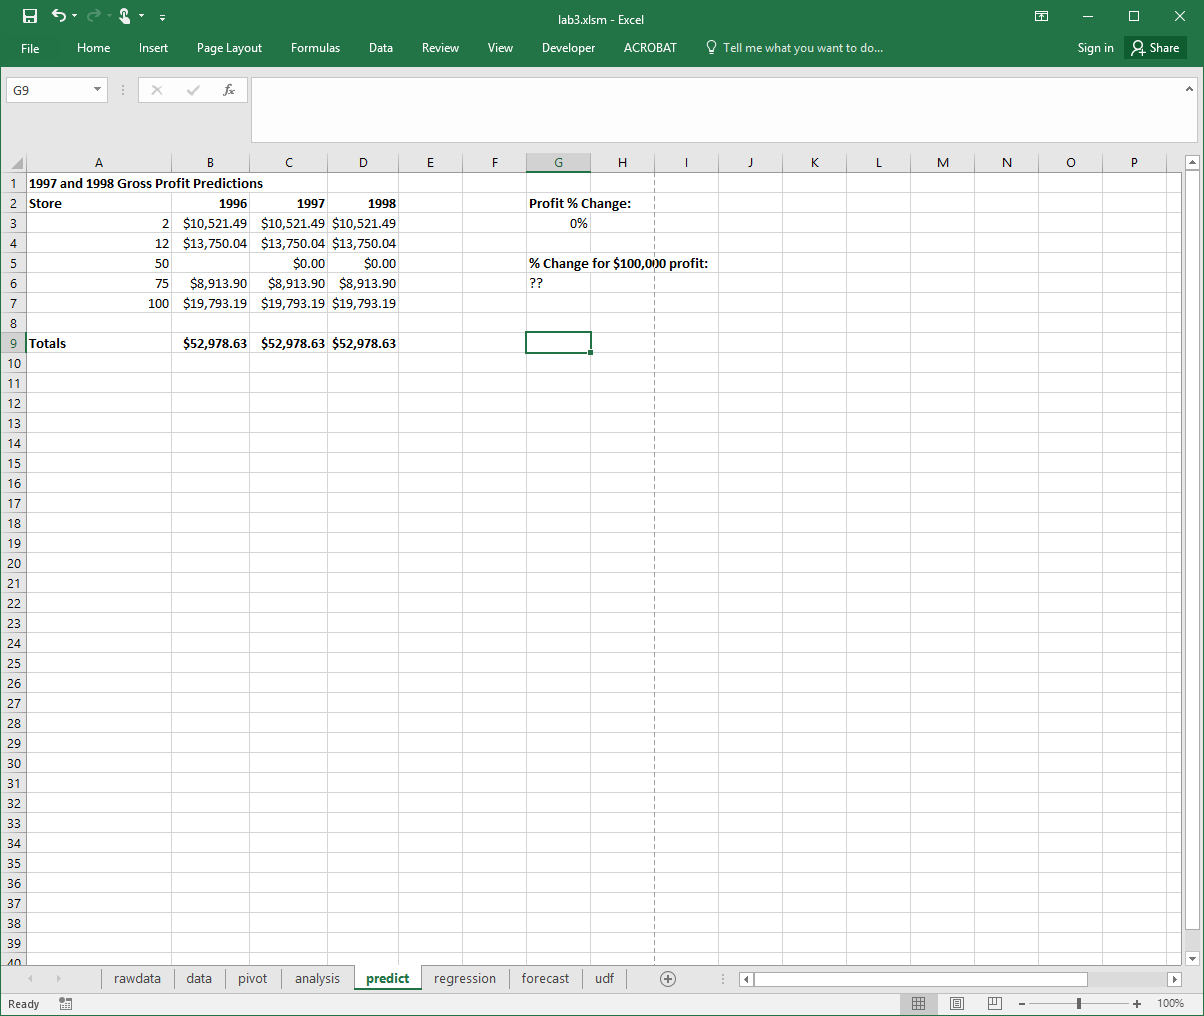
Gross profit data for 1996 per store and a column for predicted gross profit for 1997 and 1998. The predicted gross profit will be a percentage change from 1996. This percentage will be in cell H3. Use what-if scenarios to create three scenarios: 1) Good (+20%), 2) Same (0%), and 3) Bad (-20%). (2 marks)
Use goal seek to determine the % profit change necessary so total 1998 gross profit is $100,000. Put that value in cell G6. (1 mark)
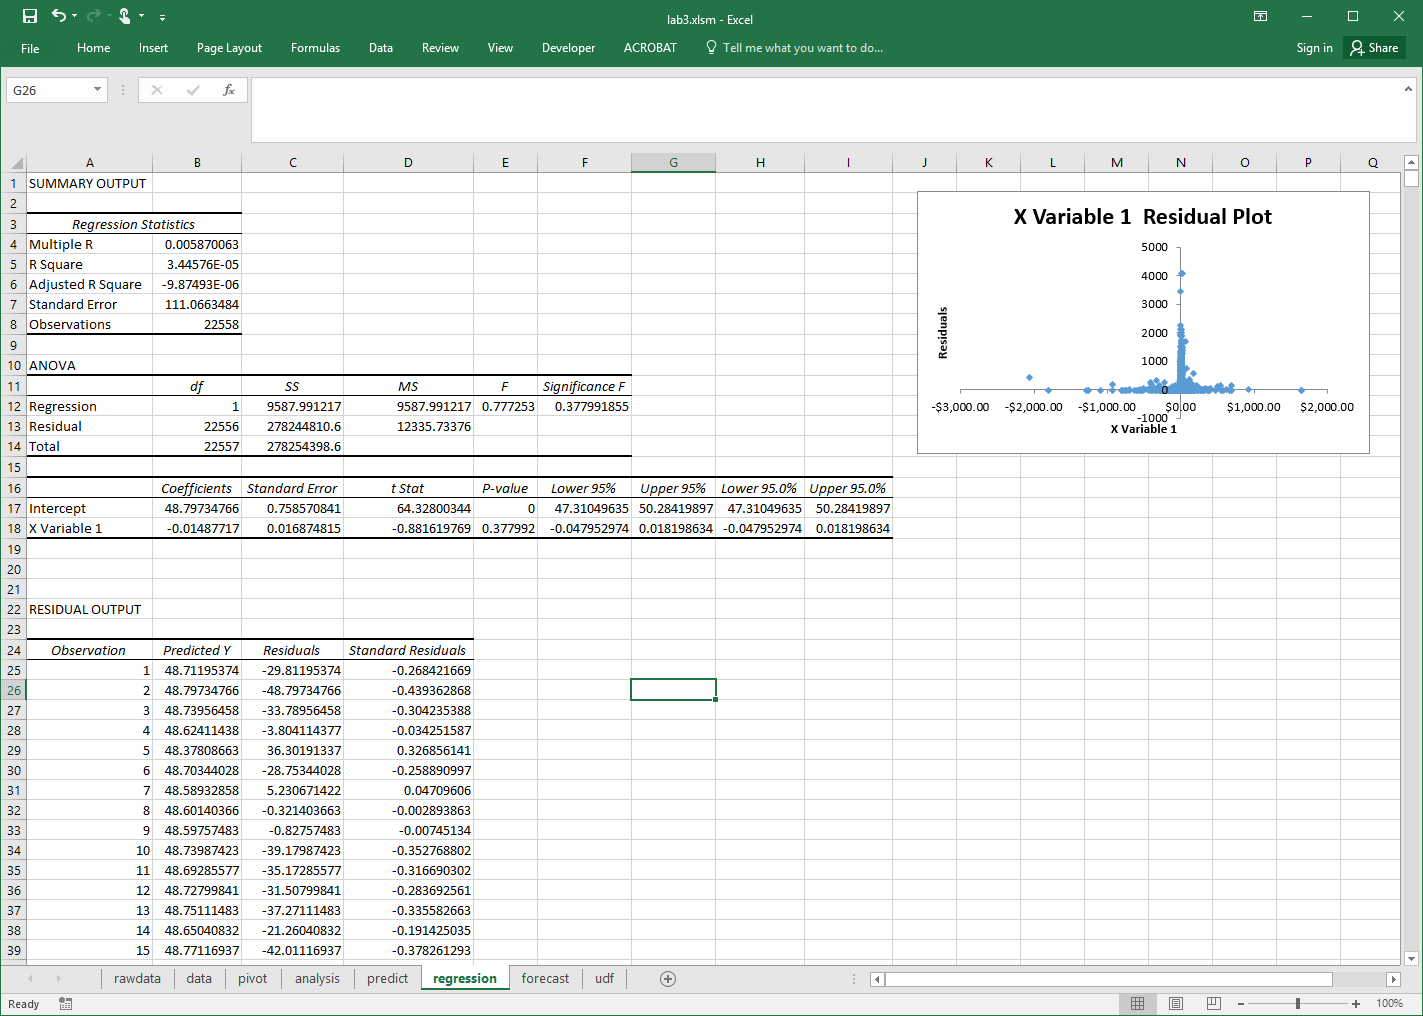
Regression (1 mark) - compute a regression on sales (Y variable) and GrossProfit (X variable) and rename the regression result sheet as regression. The regression shown uses all records including those with OK=0.
Interesting Analysis (1 mark) - create a new sheet called Interesting that performs some analysis to determine any useful insight from the data with an explanation on what you did and why it is interesting.
Bonus (1 mark) - create a UDF called age that returns an age given a (birth) date. Create a new sheet called udf to test your function.
Note: You may have additional working sheets in your spreadsheet. (The screenshots show forecast which you do not have to make).

