DATA 531 - Lab 2: Practice with Python - Solving problems, docstrings, exception handling, conditions and loops
Contents
DATA 531 - Lab 2: Practice with Python - Solving problems, docstrings, exception handling, conditions and loops#
Name: FirstName LastName
Date: September 15, 2020
Objectives#
Practice solving problems with programs that use variables, expressions, decisions, and looping/iteration.
Perform input and output using Python.
Experience with string manipulation including data splitting, cleaning, and analysis.
Practice writing docstrings for your functions
Practice writing assert statements for your functions
Fluency in reading and writing text (CSV) files including using try-except to handle exceptions.
Experience analyzing real-world, open data sets.
Retrieve files from web sites using Python code.
Using modules
pandas,numpy, andscipyfor executing a data analysis workflow including data loading, cleaning, and filteringPractice using python functions from external modules by reading the docstrings, manual
Question #1 - Calculating Taxes (5 marks)#
Write a Python function that calculates and prints the tax on a purchased item. The input of this function should be a string, and the pre-tax price of the item.
Details:
Add a docstring to this function so users know how to use it. (1 mark)
Calculate the provincial tax (5%) federal tax (7%), and store them as separate variables. (1 mark)
Choose one: A) Add at least two assert statements as tests for your code OR B) Use try/except statements to test for inputs to the function (1 mark)
Print the item amount, the provincial tax, the federal tax, and the total with all taxes included. (2 mark)
Bonus: Round tax amounts to the nearest cent and display with exactly two decimal points. (1 mark)
Question #2 - Data Cleaning (15 marks)#
Create a Python program that cleans data in string format. Data set (copy as string into Python code):
data = """5:Joe:35000:1970-08-09
4:Steve:49999:1955-01-02
1:Leah:154000:1999-06-12
3:Sheyanne:255555:1987-05-14
2:Matt:24000:1972-11-03
7:Kyla:1000000:1950-02-01
8:Dave:15000:2000-09-05
"""
Details:
Use
split()to separate data into rows (one per line). (1 mark)Use a for loop to process each line: (1 mark)
Use split() to divide data into four fields (id, name, salary, birthdate). Output the fields. Hint: Use “\t” to add tab in output. (2 marks)
Calculate the age using the birthdate and the current date. Print the age. Reference to convert string to date using strptime Note: May also use date.fromisoformat(). (3 marks)
Calculate and print the total number of people, average salary, highest salary, and youngest employee. (4 marks)
Use a for loop to process the data set again: (1 mark)
Increase the salary by 20% for any employee whose salary < 40000 or has a name that is less than 5 characters long. Print out new and previous salary. (2 marks)
Bonus: Create a list to store data in after convert from string in first pass so on second loop processing data use the list rather than parsing the string again. (2 marks)
Bonus: Update the salary directly in the list and print out the list. (1 mark)
Sample Output#
Id: 5 	Name: Joe 	Salary: 35000 	Birthdate: 1970-08-09
Age: 49
Id: 4 	Name: Steve 	Salary: 49999 	Birthdate: 1955-01-02
Age: 64
Id: 1 	Name: Leah 	Salary: 154000 	Birthdate: 1999-06-12
Age: 20
Id: 3 	Name: Sheyanne 	Salary: 255555 	Birthdate: 1987-05-14
Age: 32
Id: 2 	Name: Matt 	Salary: 24000 	Birthdate: 1972-11-03
Age: 46
Id: 7 	Name: Kyla 	Salary: 1000000 	Birthdate: 1950-02-01
Age: 69
Id: 8 	Name: Dave 	Salary: 15000 	Birthdate: 2000-09-05
Age: 19

Number of people: 7
Total salary: 1533554 Average salary: 219079.14285714287 Max salary: 1000000
Youngest employee: Dave

Joe Old salary: 35000 New salary: 42000.0
Leah Old salary: 154000 New salary: 184800.0
Matt Old salary: 24000 New salary: 28800.0
Kyla Old salary: 1000000 New salary: 1200000.0
Dave Old salary: 15000 New salary: 18000.0

Bonus:
Joe Old salary: 35000 New salary: 42000.0
Leah Old salary: 154000 New salary: 184800.0
Matt Old salary: 24000 New salary: 28800.0
Kyla Old salary: 1000000 New salary: 1200000.0
Dave Old salary: 15000 New salary: 18000.0
[['5', 'Joe', 42000.0, '1970-08-09'], ['4', 'Steve', 49999, '1955-01-02'], ['1', 'Leah', 184800.0, '1999-06-12'], ['3', 'Sheyanne', 255555, '1987-05-14'], ['2', 'Matt', 28800.0, '1972-11-03'], ['7', 'Kyla', 1200000.0, '1950-02-01'], ['8', 'Dave', 18000.0, '2000-09-05']]
### Your answer here
Question #3 - Data Analysis of GDP Data Stored as a CSV File (5 marks)#
Create a Python program that uses the open data set on GDP from the Canadian government 36100293.csv (Original data source) to answer some GDP questions and produce a graph. Details:
Ensure the data file 36100293.csv is in your code directory for input. There is also a metadata file 36100293_MetaData.csv providing info on the data file (not required to use).
Create an empty dictionary that will eventually have the year as a key and the GDP for that year as a value. Create two empty lists to store year and GDP data. (1 marks)
Read the data file using the
csvmodule and store the GDP for each year in the dictionary and the year and GDP in each list. Code must use try-except to handle any errors. Note that this data set has lots of data besides GDP so you will need to determine which rows store GDP values. (1 mark)Prompt the user for a year and output the GDP for that year from the dictonary. (1 mark)
Calculate and print the GDP change from the user year and the GDP in the 1970. (1 mark)
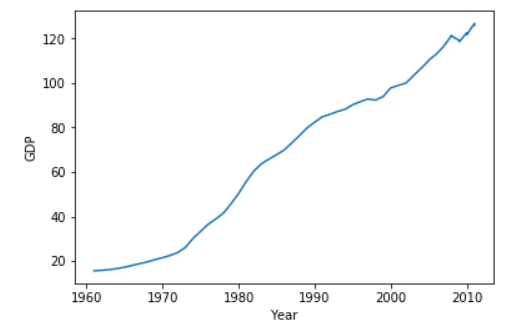
Create a line chart using matplotlib showing the GDP from 1961 to 2011. Here is matplotlib line chart example code Use the GDP and year lists created previously for the chart data. (1 mark)
Sample Output#
Enter a year to lookup GDP: 1965
GDP in 1965 was 17.2 billion dollars which is -20.000000000000004 % different than 1970.
### Helpful hint
"""You can prompt the user for a value like this:"""

value_returned = input('Value')
---------------------------------------------------------------------------
StdinNotImplementedError                  Traceback (most recent call last)
Input In [2], in <cell line: 4>()
      1 ### Helpful hint
      2 """You can prompt the user for a value like this:"""
----> 4 value_returned = input('Value')

File /opt/hostedtoolcache/Python/3.9.13/x64/lib/python3.9/site-packages/ipykernel/kernelbase.py:1174, in Kernel.raw_input(self, prompt)
   1167 """Forward raw_input to frontends
   1168
   1169 Raises
   1170 ------
   1171 StdinNotImplementedError if active frontend doesn't support stdin.
   1172 """
   1173 if not self._allow_stdin:
-> 1174     raise StdinNotImplementedError(
   1175         "raw_input was called, but this frontend does not support input requests."
   1176     )
   1177 return self._input_request(
   1178     str(prompt),
   1179     self._parent_ident["shell"],
   1180     self.get_parent("shell"),
   1181     password=False,
   1182 )

StdinNotImplementedError: raw_input was called, but this frontend does not support input requests.
### Your answer here
Optional question (for practice; not for marks)#
Question #2 - Data Analysis Pipeline using Python Modules (15 marks)#
Create a Python program that reads data on Canadian household incomes from open data web site (Data source) and performs analysis and reporting. Details:
Put a comment at the top of the Python file called
lab4q2with your name.The data source URL is https://www150.statcan.gc.ca/n1/tbl/csv/11100032-eng.zip. Download zip file using
urllib.requestA method calledurlretrievemay be deprecated in the future but is very easy to use for this. (1 mark) Reference example for urllibUnzip the file using
zipfilemodule andextractallmethod. (1 mark) zipfile reference and zipfile extractall example Note: Once you have the data downloaded and unzipped, comment out this code until submission so you do not keep downloading the data!Use
pandasmodule andread_csvmethod to read CSV file. (1 mark)Filter the data to include only
Canadadata and print the number of rows. (2 marks)Produce two subsets of the data:
All data rows with
Average total income.All data rows with
Average income tax.
Print out number of rows in each data set and use
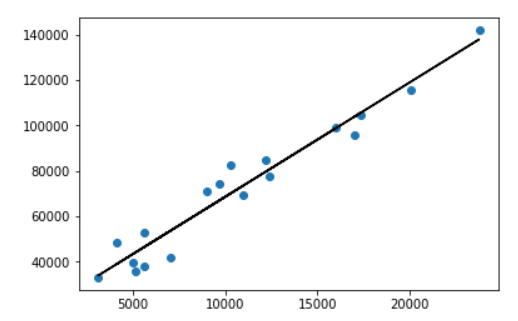
head(4)to print out first 4 rows in tax data set (showing onlyIncome conceptandVALUEcolumns.) Pandas reference (3 marks)Perform and graph the output for a linear regression
(tax, income)on theVALUEcolumn for these two data subsets. (2 marks)Create a
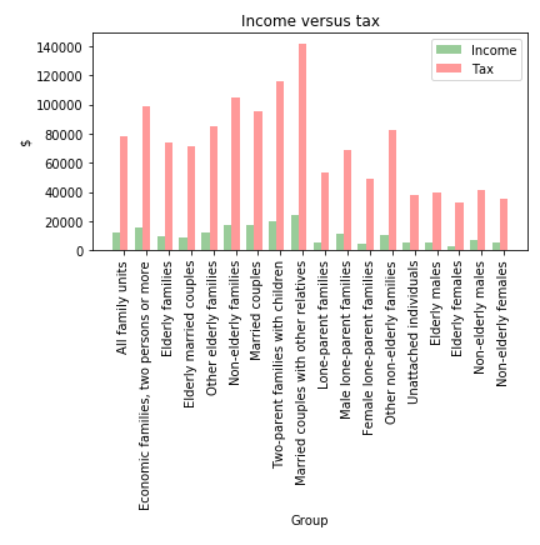
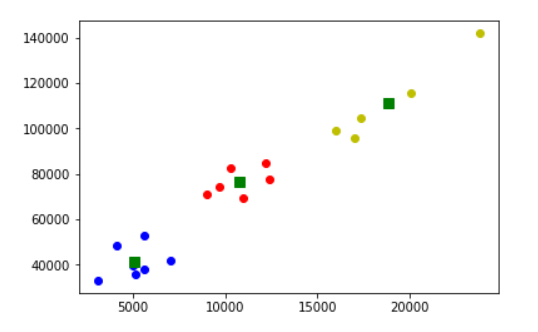
matplotlibbar chart with bars fortaxandincomeand x-axis labels the family categories (Economic family type). Note: To resize figure larger use:plt.figure(figsize=(6,6))(2 marks)Perform a k-means clustering with 3 clusters and graph results. Use sample code in notes with slight modification. (3 marks)
Sample Output#
Number of data rows for Canada: 216
Number of data rows: 18
Number of data rows: 18
     Income concept    VALUE
108  Average income tax  12400.0
109  Average income tax  16000.0
110  Average income tax   9700.0
111  Average income tax   9000.0