Lecture 5: Introduction to R
Note from Firas
Our series of R lectures will be presented by Dr. Tiffany Timbers, the other option co-director of the Vancouver MDS program.
Her lecture videos are not yet posted on YouTube, but I’ve got them locally so that’s how we’ll watch them.
High level goal for part II of this course:
Learn the R’isms of the R programming language.
First, a bit of history about me
Ph.D. in Neuroscience (2012)
Started using R in ~ 2010 because I needed to do “complex” statistics
Other programming languages I have used:
Turing
Java
Matlab
Python (only other language that I still currently use and remember)
Oh, and I like gifs, so you might see some in my lecture notes…

Now, a bit of history about R
An implementation of the S programming language (created at Bell labs in 1976)
written in C, Fortran, and R itself
R was created by Ross Ihaka and Robert Gentleman (Statisticians from NZ)
R is named partly after the authors and partly as a play on the name of S
First stable beta version in 2000
Source: https://blog.revolutionanalytics.com/2016/03/16-years-of-r-history.html
R currently has more than 15,000 additional packages (as of September 2018)!
So, who’s used R before?
Let’s start with a vignette
library(tidyverse, quietly = TRUE)
us_2015_econ <- read_csv("data/state_property_data.csv")
head(us_2015_econ)
── Attaching packages ─────────────────────────────────────── tidyverse 1.3.0 ──
✔ ggplot2 3.3.2     ✔ purrr   0.3.4
✔ tibble  3.0.1     ✔ dplyr   1.0.0
✔ tidyr   1.1.0     ✔ stringr 1.4.0
✔ readr   1.3.1     ✔ forcats 0.5.0
── Conflicts ────────────────────────────────────────── tidyverse_conflicts() ──
✖ dplyr::filter() masks stats::filter()
✖ dplyr::lag()    masks stats::lag()
Error: 'data/state_property_data.csv' does not exist in current working directory ('/Users/firasm/Sync/Teaching/ubco/data531_course/class').
Traceback:

1. read_csv("data/state_property_data.csv")
2. read_delimited(file, tokenizer, col_names = col_names, col_types = col_types,
 .     locale = locale, skip = skip, skip_empty_rows = skip_empty_rows,
 .     comment = comment, n_max = n_max, guess_max = guess_max,
 .     progress = progress)
3. standardise_path(file)
4. check_path(path)
5. stop("'", path, "' does not exist", if (!is_absolute_path(path)) paste0(" in current working directory ('",
 .     getwd(), "')"), ".", call. = FALSE)
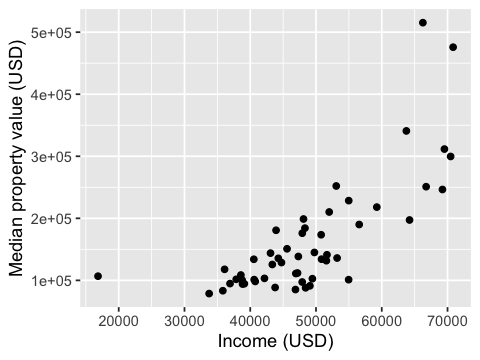
options(repr.plot.height = 3, repr.plot.width = 4)
ggplot(us_2015_econ, aes(x = med_income, y = med_prop_val)) +
  geom_point() +
  xlab("Income (USD)") +
  ylab("Median property value (USD)")
us_2016_vote <- read_csv("data/2016_presidential_election_state_vote.csv")
head(us_2016_vote)
Parsed with column specification:
cols(
  party = col_character(),
  state = col_character()
)
| party | state |
|---|---|
| <chr> | <chr> |
| republican | AL |
| republican | AK |
| republican | AZ |
| republican | AR |
| democrat | CA |
| democrat | CO |
us_data <- left_join(us_2015_econ, us_2016_vote)
head(us_data)
Joining, by = "state"
| state | med_income | med_prop_val | population | mean_commute_minutes | party |
|---|---|---|---|---|---|
| <chr> | <dbl> | <dbl> | <dbl> | <dbl> | <chr> |
| AK | 64222 | 197300 | 733375 | 10.46830 | republican |
| AL | 36924 | 94800 | 4830620 | 25.30991 | republican |
| AR | 35833 | 83300 | 2958208 | 22.40109 | republican |
| AZ | 44748 | 128700 | 6641928 | 20.58786 | republican |
| CA | 53075 | 252100 | 38421464 | 23.38085 | democrat |
| CO | 48098 | 198900 | 5278906 | 19.50792 | democrat |
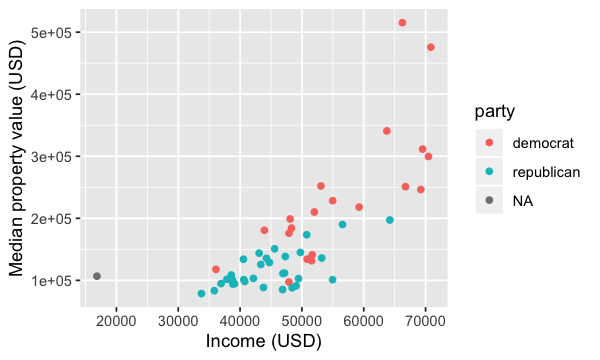
options(repr.plot.height = 3, repr.plot.width = 5)
ggplot(us_data, aes(x = med_income, y = med_prop_val, color = party)) +
  geom_point() +
  xlab("Income (USD)") +
  ylab("Median property value (USD)")
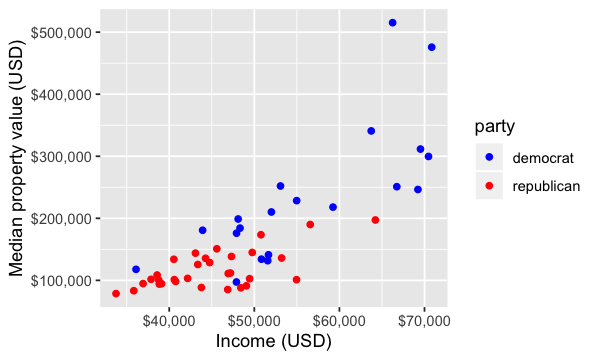
state_data <- filter(us_data, party != "Not Applicable")
ggplot(state_data, aes(x = med_income, y = med_prop_val, color = party)) +
    geom_point() +
    xlab("Income (USD)") +
    ylab("Median property value (USD)") +
    scale_colour_manual(values = c("blue", "red")) +
    scale_x_continuous(labels = scales::dollar_format()) +
    scale_y_continuous(labels = scales::dollar_format())
The whole game
What about this makes R an attractive language for data science?
What is different about this R code compared to other common languages?
How & why does R do these things?
Answering these questions is the aim of the second part of this course!
Lecture learning objectives:
By then end of the lecture & lab 3, students should be able to:
Use the assignment symbol,
<-, to assign values to objects in R and explain how it differs from=Create in R, and define and differentiate in English, the below listed key datatypes in R:
logical, numeric and character vectors
lists
data frames and tibbles
Use R to determine the type and structure of an object
Explain the distinction between names and values, and when R will copy an object
Use the three subsetting operators,
[[,[, and$, to subset single and multiple elements from vectors and data framesCompute numeric and boolean values using their respective types and operations
Write conditional statements in R with
if,else ifandelseto run different code depending on the inputWrite for loops in R to repeatedly run code
Write R code that is human readable and follows the tidyverse style guide
The assignment symbol, <-
R came from S, S used
<-S was inspired from APL, which also used
<-APL was designed on a specific keyboard, which had a key for
<-At that time there was no
==for testing equality, it was tested with=, so something else need to be used for assignment.
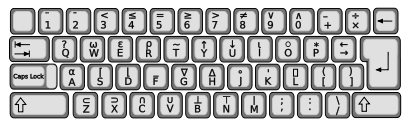
source: https://colinfay.me/r-assignment/
The assigment symbol, <-
Nowadays,
=can also be used for assignment, however there are some things to be aware of…
stylistically,
<-is preferred over=for readability
<-and->are valid in R, the latter can be useful in pipelines (more on this in data wrangling)
<-and=have different emphasis in regards to environments
we expect you to use
<-in MDS for object assignment in R
Assignment readability
Consider this code:
c <- 12
d <- 13
Which equality is easier to read?
e = c == d
or
e <- c == d
Assignment environment
What value does x hold at the end of each of these code chunks?
median(x = 1:10)
vs
median(x <- 1:10)
median(y = 1:10)
x
Error in is.factor(x): argument "x" is missing, with no default
Traceback:

1. median(y = 1:10)
2. median.default(y = 1:10)
3. is.factor(x)
median(x <- 1:10)
x
- 1
- 2
- 3
- 4
- 5
- 6
- 7
- 8
- 9
- 10
What does assignment do in R?
When you type this into R: x <- c(1, 2, 3)
This is what R does:
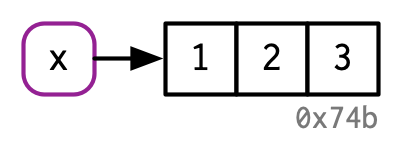
Source: Advanced R by Hadley Wickham
What does assignment do in R?
And then if you type y <- c(1, 2, 3)
Then R does this:
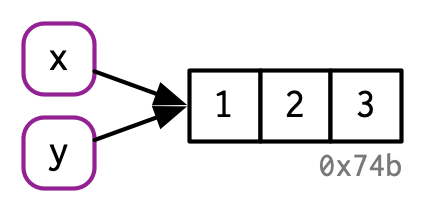
We are binding names like “x” and/or “y” to objects, not creating objects named something like “x” or “y”.
Source: Advanced R by Hadley Wickham
A note on names
Rules for syntactic names:
May use: letters, digits,
.and_Cannot begin with
_or a digitCannot use reserved words (e.g.,
for,if,return)
How to manage non-syntactic names
Usually come across these when reading in someone else’s data
Backticks, `, can be used manage these cases (e.g.,
`_abc` <- 1)If your data contains these, use R to rename things to make them syntactic (for your future sanity)
Key datatypes in R
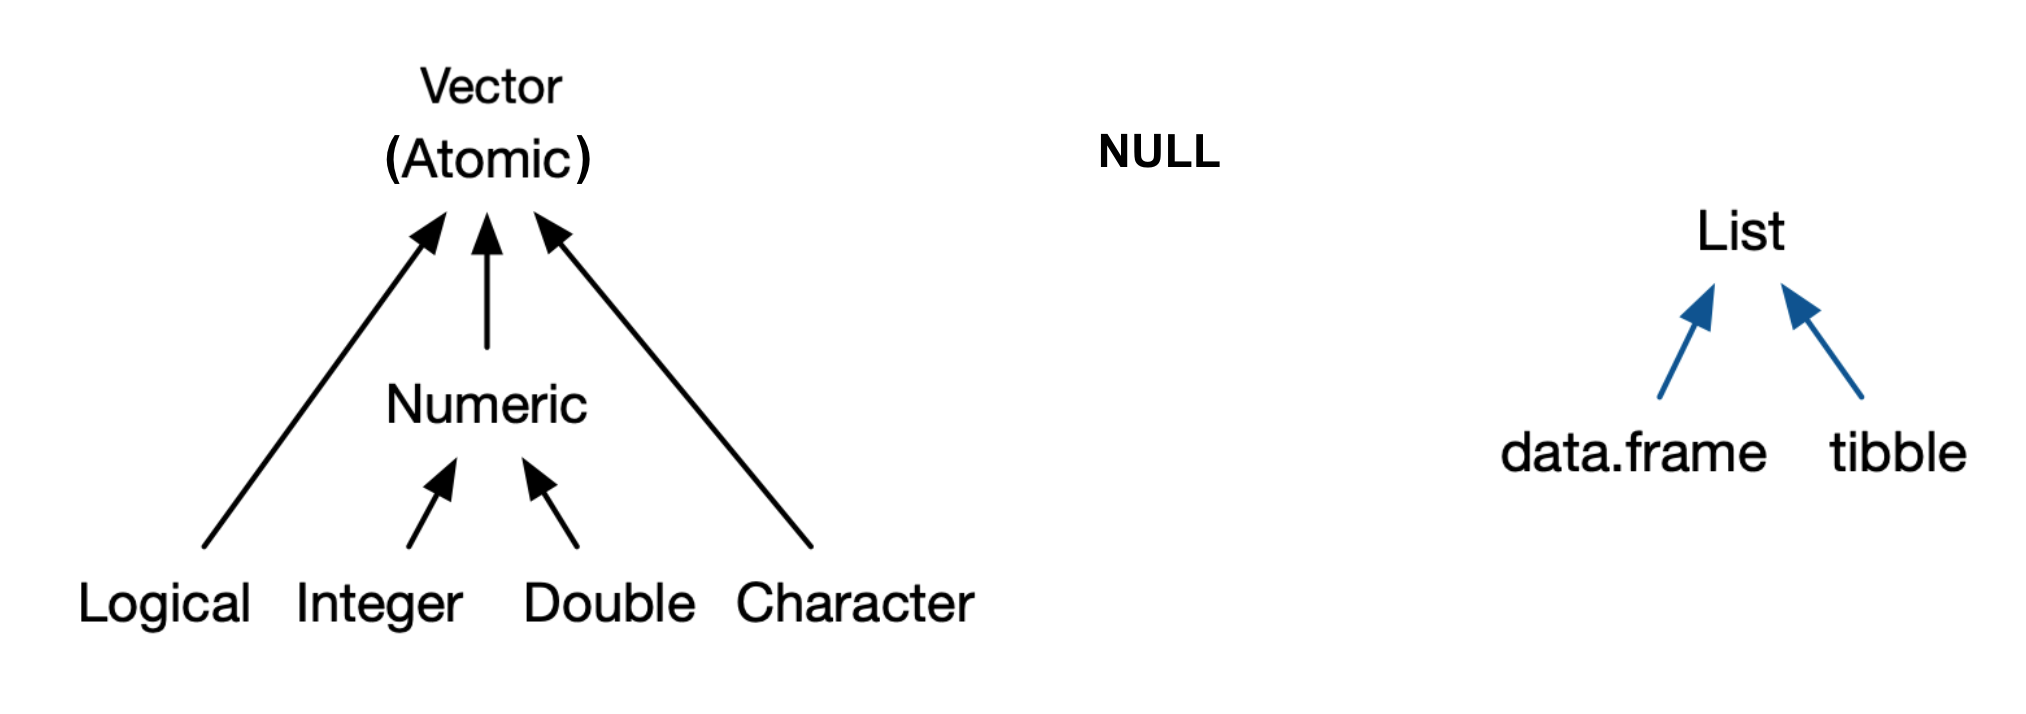
note - There are no scalars in R, they are represented by vectors of length 1.
Source: Advanced R by Hadley Wickham
NULLis not a vector, but related and frequently functions in the role of a generic zero length vector.
What is a data frame?
From a data perspective, it is a rectangle where the rows are the observations:


What is a data frame?
From a computer programming perspective, in R, a data frame is a special subtype of a list object whose elements (columns) are vectors.

Question: What do you notice about the elements of each of the vectors in this data frame?
What is a vector?
objects that can contain 1 or more elements
elements are ordered
must all be of the same type (e.g., double, integer, character, logical)

How are vectors different from a list?

Reminder: what do lists have to do with data frames?

A bit more about Vectors
Your closest and most important friend in R

Creating vectors and vector types
char_vec <- c("joy", "peace", "help", "fun", "sharing")
char_vec
typeof(char_vec)
- 'joy'
- 'peace'
- 'help'
- 'fun'
- 'sharing'
log_vec <- c(TRUE, TRUE, FALSE, FALSE, TRUE)
log_vec
typeof(log_vec)
- TRUE
- TRUE
- FALSE
- FALSE
- TRUE
double_vec <- c(1, 2, 3, 4, 5)
double_vec
typeof(double_vec)
- 1
- 2
- 3
- 4
- 5
int_vec <- c(1L, 2L, 3L, 4L, 5L)
int_vec
typeof(int_vec)
- 1
- 2
- 3
- 4
- 5
str is a useful command to get even more information about an object:
str(int_vec)
int [1:5] 1 2 3 4 5
What happens to vectors of mixed type?
mixed_vec <- c("joy", 5.6, TRUE, 1L, "sharing")
typeof(mixed_vec)
Hierarchy for coercion:
character → double → integer → logical
Useful functions for testing type and forcing coercion:
is.logical(),is.integer(),is.double(), andis.character()returnsTRUEorFALSE, depending on type of object and function used.as.logical(),as.integer(),as.double(), oras.character()coerce vector to type specified by function name.
How to subset and modify vectors

Subsetting
REMEMBER - R counts from 1!!!
name <- c("T", "i", "f", "f", "a", "n", "y")
What letter will I get in R? What would I get in Python?
name[3]
What letters will I get in R? What would I get in Python?
name[2:4]
- 'i'
- 'f'
- 'f'
What letter will I get in R? What would I get in Python?
name[-1]
- 'i'
- 'f'
- 'f'
- 'a'
- 'n'
- 'y'
How do I get the last element in a vector in R?
name[length(name)]
Modifing vectors
We can combine the assignment symbol and subsetting to modify vectors:
name
- 'T'
- 'i'
- 'f'
- 'f'
- 'a'
- 'n'
- 'y'
name[1] <- "t"
name
- 't'
- 'i'
- 'f'
- 'f'
- 'a'
- 'n'
- 'y'
name[1:3] <- c("T", "I", "F")
name
name[8:12]
- 'T'
- 'I'
- 'F'
- 'f'
- 'a'
- 'n'
- 'y'
- NA
- NA
- NA
- NA
- NA
name[8:12] <- c("-", "A", "n", "n", "e")
name
- 'T'
- 'I'
- 'F'
- 'f'
- 'a'
- 'n'
- 'y'
- '-'
- 'A'
- 'n'
- 'n'
- 'e'
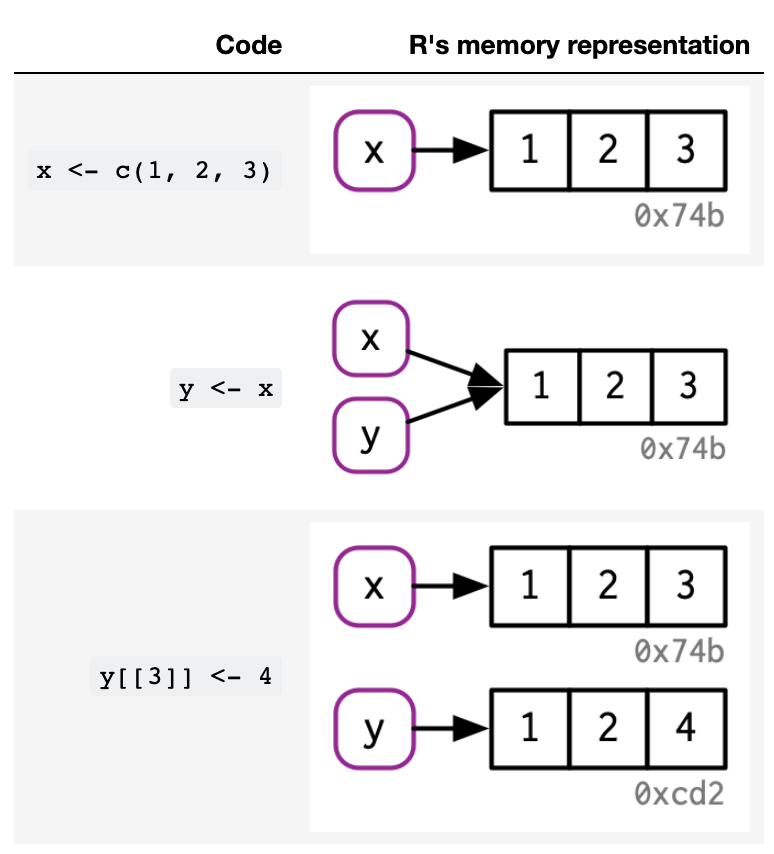
What happens when you modify a vector in R?
Consider:
x <- c(1, 2, 3)
y <- x

y[3] <- 4
x
#> [1] 1 2 3
What is happening in R’s memory for each line of code?
Code |
R’s memory representation |
|---|---|
|
|
|
|
|
|
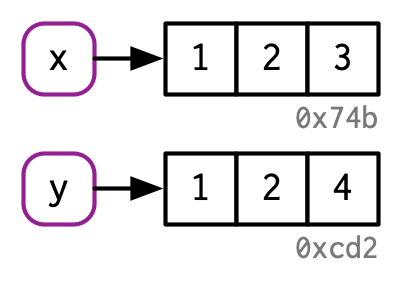
This is called “copy-on-modify”.
Source: Advanced R by Hadley Wickham
This is called “copy-on-modify”.
Source: Advanced R by Hadley Wickham
Why copy-on-modify
Since there are no scalars in R, vectors are essentially immutable
If you change one element of the vector, you have to copy the whole thing to update it
Why do we care about knowing this?
Given that data frames are built on-top of vectors, this has implications for speed when working with large data frames
Why vectors?
Vectorized operations!
c(1, 2, 3, 4) + c(1, 1, 1, 1)
- 2
- 3
- 4
- 5
But watch out for vector recycling in R!
This makes sense:
c(1, 2, 3, 4) + c(1)
- 2
- 3
- 4
- 5
but this does not!
c(1, 2, 3, 4) + c(1, 2)
- 2
- 4
- 4
- 6
A list of vector operators here: R Operators cheat sheet
One to watch out for, logical and (&) and or (|) operators come in both an elementwise and first element comparison form, for example:
# compares each elements of each vector by position
c(TRUE, TRUE, TRUE) & c(FALSE, TRUE, TRUE)
- FALSE
- TRUE
- TRUE
# compares only the first elements of each vector
c(TRUE, TRUE, TRUE) && c(FALSE, TRUE, TRUE)
Extending our knowledge to data frames
Getting to know a data frame
head(us_data)
| state | med_income | med_prop_val | population | mean_commute_minutes | party |
|---|---|---|---|---|---|
| <chr> | <dbl> | <dbl> | <dbl> | <dbl> | <chr> |
| AK | 64222 | 197300 | 733375 | 10.46830 | republican |
| AL | 36924 | 94800 | 4830620 | 25.30991 | republican |
| AR | 35833 | 83300 | 2958208 | 22.40109 | republican |
| AZ | 44748 | 128700 | 6641928 | 20.58786 | republican |
| CA | 53075 | 252100 | 38421464 | 23.38085 | democrat |
| CO | 48098 | 198900 | 5278906 | 19.50792 | democrat |
str(us_data)
Classes ‘spec_tbl_df’, ‘tbl_df’, ‘tbl’ and 'data.frame':	52 obs. of  6 variables:
 $ state               : chr  "AK" "AL" "AR" "AZ" ...
 $ med_income          : num  64222 36924 35833 44748 53075 ...
 $ med_prop_val        : num  197300 94800 83300 128700 252100 ...
 $ population          : num  733375 4830620 2958208 6641928 38421464 ...
 $ mean_commute_minutes: num  10.5 25.3 22.4 20.6 23.4 ...
 $ party               : chr  "republican" "republican" "republican" "republican" ...
Subsetting and modifying data frames
There are 3 operators that can be used when subsetting data frames: [, $ and [[
Note that $ and [[ remove a level of structure from the data frame (this happens with lists too).
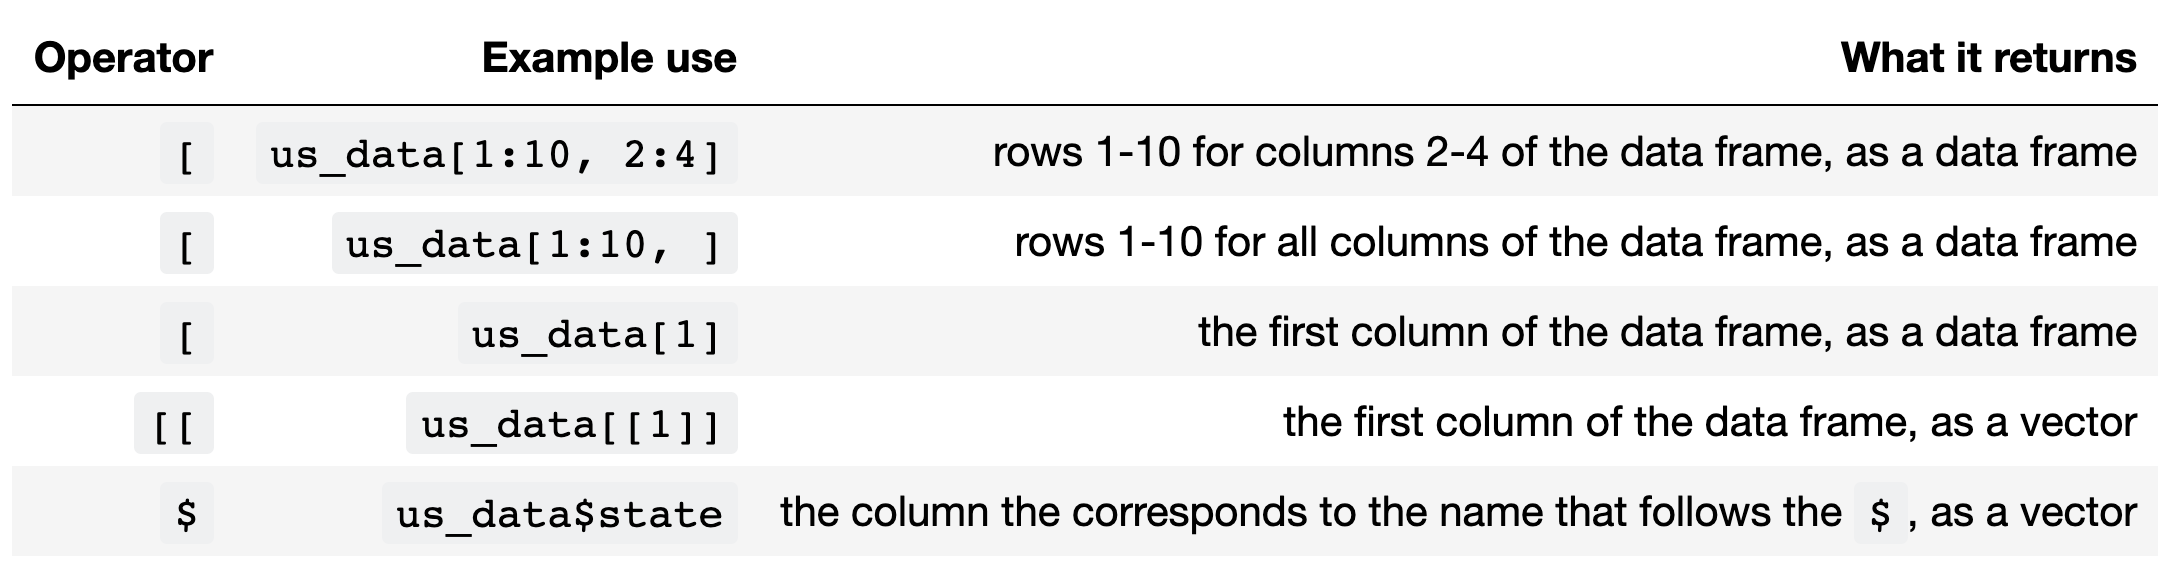
Subsetting and modifying data frames
There are 3 operators that can be used when subsetting data frames: [, $ and [[
Operator |
Example use |
What it returns |
|---|---|---|
|
|
rows 1-10 for columns 2-4 of the data frame, as a data frame |
|
|
rows 1-10 for all columns of the data frame, as a data frame |
|
|
the first column of the data frame, as a data frame |
|
|
the first column of the data frame, as a vector |
|
|
the column the corresponds to the name that follows the |
Note that $ and [[ remove a level of structure from the data frame object (this happens with lists too).
Logical indexing of data frames
We can also use logical statements to filter for rows containing certain values, or values above or below a threshold:
us_data[us_data$party == "republican", ]
| state | med_income | med_prop_val | population | mean_commute_minutes | party |
|---|---|---|---|---|---|
| <chr> | <dbl> | <dbl> | <dbl> | <dbl> | <chr> |
| AK | 64222.0 | 197300 | 733375 | 10.46830 | republican |
| AL | 36924.0 | 94800 | 4830620 | 25.30991 | republican |
| AR | 35833.0 | 83300 | 2958208 | 22.40109 | republican |
| AZ | 44748.0 | 128700 | 6641928 | 20.58786 | republican |
| FL | 43355.0 | 125600 | 19645772 | 24.78056 | republican |
| GA | 37865.0 | 101700 | 10006693 | 24.54914 | republican |
| IA | 49448.0 | 102700 | 3093526 | 18.35024 | republican |
| ID | 43080.5 | 143900 | 1616547 | 19.85348 | republican |
| IN | 47194.0 | 111800 | 6568645 | 23.51750 | republican |
| KS | 46875.0 | 85200 | 2892987 | 16.69279 | republican |
| KY | 38827.5 | 94050 | 4397353 | 24.48608 | republican |
| LA | 40757.5 | 98250 | 4625253 | 25.91754 | republican |
| ME | 45594.0 | 150850 | 1329100 | 21.98533 | republican |
| MI | 42161.0 | 103200 | 9900571 | 21.92783 | republican |
| MO | 40597.0 | 101200 | 6045448 | 22.39583 | republican |
| MS | 33748.5 | 78700 | 2988081 | 25.55173 | republican |
| MT | 44267.0 | 135550 | 1014699 | 16.02368 | republican |
| NC | 40543.5 | 134000 | 9845333 | 23.76222 | republican |
| ND | 54960.0 | 101100 | 721640 | 16.33698 | republican |
| NE | 49068.0 | 91200 | 1869365 | 16.43135 | republican |
| OH | 46931.0 | 111050 | 11575977 | 23.52100 | republican |
| OK | 43781.0 | 88500 | 3849733 | 21.11157 | republican |
| PA | 47313.0 | 138500 | 12779559 | 24.08609 | republican |
| NA | NA | NA | NA | NA | NA |
| SC | 38769.5 | 100450 | 4777576 | 25.11677 | republican |
| SD | 48415.5 | 88000 | 843190 | 15.06729 | republican |
| TN | 38576.0 | 108600 | 6499615 | 25.52855 | republican |
| TX | 53207.0 | 136000 | 26538614 | 21.49733 | republican |
| UT | 50781.0 | 173500 | 2903379 | 18.93005 | republican |
| WI | 49754.5 | 145000 | 5742117 | 21.14367 | republican |
| WV | 39096.0 | 94600 | 1851420 | 27.10972 | republican |
| WY | 56569.0 | 190000 | 579679 | 18.67275 | republican |
Another example:
us_data[us_data$mean_commute_minutes > 25, ]
| state | med_income | med_prop_val | population | mean_commute_minutes | party |
|---|---|---|---|---|---|
| <chr> | <dbl> | <dbl> | <dbl> | <dbl> | <chr> |
| AL | 36924.0 | 94800 | 4830620 | 25.30991 | republican |
| DC | 70848.0 | 475800 | 647484 | 28.25340 | democrat |
| LA | 40757.5 | 98250 | 4625253 | 25.91754 | republican |
| MD | 66745.5 | 250950 | 5930538 | 28.61998 | democrat |
| MS | 33748.5 | 78700 | 2988081 | 25.55173 | republican |
| NJ | 70471.0 | 299700 | 8904413 | 28.80077 | democrat |
| PR | 16851.5 | 106750 | 3583073 | 28.02170 | NA |
| SC | 38769.5 | 100450 | 4777576 | 25.11677 | republican |
| TN | 38576.0 | 108600 | 6499615 | 25.52855 | republican |
| VA | 47911.0 | 176000 | 8256630 | 26.20629 | democrat |
| WV | 39096.0 | 94600 | 1851420 | 27.10972 | republican |
Modifing data frames
Similar to vectors, we can combine the assignment symbol and subsetting to modify data frames.
For example, here we create a new column called mean_commute_hours:
us_data$mean_commute_hours <- us_data$mean_commute_minutes / 50
head(us_data)
| state | med_income | med_prop_val | population | mean_commute_minutes | party | mean_commute_hours |
|---|---|---|---|---|---|---|
| <chr> | <dbl> | <dbl> | <dbl> | <dbl> | <chr> | <dbl> |
| AK | 64222 | 197300 | 733375 | 10.46830 | republican | 0.2093660 |
| AL | 36924 | 94800 | 4830620 | 25.30991 | republican | 0.5061981 |
| AR | 35833 | 83300 | 2958208 | 22.40109 | republican | 0.4480218 |
| AZ | 44748 | 128700 | 6641928 | 20.58786 | republican | 0.4117572 |
| CA | 53075 | 252100 | 38421464 | 23.38085 | democrat | 0.4676170 |
| CO | 48098 | 198900 | 5278906 | 19.50792 | democrat | 0.3901584 |
The same syntax works to overwrite an existing column.
What happens when we modify an entire column? or a row?
To answer this we need to look at how data frames are represented in R’s memory.
How R represents data frames:
Remember that data frames are lists of vectors
As such, they don’t store the values themselves, they store references to them:
d1 <- data.frame(x = c(1, 5, 6), y = c(2, 4, 3))
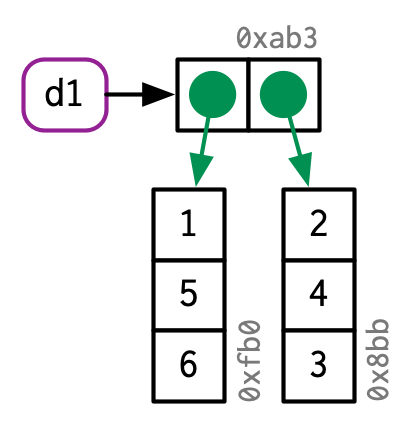
Source: Advanced R by Hadley Wickham
How R represents data frames:
If you modify a column, only that column needs to be modified; the others will still point to their original references:
d2[, 2] <- d2[, 2] * 2```

<img src="https://d33wubrfki0l68.cloudfront.net/c19fd7e31bf34ceff73d0fac6e3ea22b09429e4a/23d8d/diagrams/name-value/d-modify-c.png" width="250">

*Source: [Advanced R](https://adv-r.hadley.nz/) by Hadley Wickham*
How R represents data frames:
However, if you modify a row, every column is modified, which means every column must be copied:
d3[1, ] <- d3[1, ] * 3```

<img src="https://d33wubrfki0l68.cloudfront.net/36df61f54d1ac62e066fb814cb7ba38ea6047a74/facf8/diagrams/name-value/d-modify-r.png" width="400">

*Source: [Advanced R](https://adv-r.hadley.nz/) by Hadley Wickham*
An exception to copy-on-modify
If an object has a single name bound to it, R will modify it in place:
v <- c(1, 2, 3)

v[[3]] <- 4
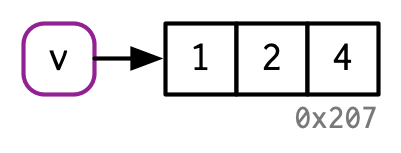
Hence, modify in place can be a useful optimization for speeding up code.
However, there are some complications that make predicting exactly when R applies this optimisation challenging (see here for details)
There is one other time R will do this, we will cover this when we get to environments.
Source: Advanced R by Hadley Wickham
Control Flow: for loops
For loops in R, work like this:
for (item in vector) perform_actionWhen code needs to be split across lines in R, we use the
{operator to surround it
Challenge or, are you still awake ;p
Rearrange this code to make a working for loop in R. Then discuss with your neighbour when the index is updated.
## Answer

for (i in 1:3) {
    i <- i * 2
    print(i)
}
[1] 2
[1] 4
[1] 6
Pro-tip for for loops in R
Beware of this:
means <- c()
for (i in 1:length(means)) {
  print(i)
}
[1] 1
[1] 0
That might seem not too bad, but it is if you are trying to actually do something:
means <- c()
out <- vector("list", length(means))
for (i in 1:length(means)) {
  out[[i]] <- rnorm(10, means[[i]])
}
Error in rnorm(10, means[[i]]): invalid arguments
Traceback:

1. rnorm(10, means[[i]])
What went wrong here and how can we avoid it?
This occurs because : works with both increasing and decreasing sequences:
1:length(means)
- 1
- 0
Source: Advanced R by Hadley Wickham
Pro-tip for for loops in R
Use seq_along(x) instead. It always returns a value the same length as x:
seq_along(means)
means <- c()
for (i in seq_along(means)) {
  print(i)
}
means <- c()
out <- vector("list", length(means))
for (i in seq_along(means)) {
  out[[i]] <- rnorm(10, means[[i]])
}
Source: Advanced R by Hadley Wickham
Control Flow: if, if else and else statements
The basic form of an if statement in R is as follows:
if (condition) true_action
if (condition) true_action else false_action
Again, when code needs to be split across lines in R, we use the
{operator to surround it to create code blocks
Challenge or, are you still awake ;p
Rearrange this code to make a working if, if else and else statement in R.
## Answer

threshold <- 95.0
measure  <- 93.5

if (measure > threshold) {
    print("Over the limit")
} else if (measure < threshold) {
    print("Under the limit")
} else {
    print("Exactly at threshold")
}
[1] "Under the limit"
Writing readable R code
WriTing AND reading (code) TaKes cognitive RESOURCES, & We only hAvE so MUCh!
To help free up cognitive capacity, we will follow the tidyverse style guide
Sample code not in tidyverse style
Can we spot what’s wrong?
Sample code in tidyverse style
What did we learn today?
Additional resources:
Attribution:
Advanced R by Hadley Wickham
Why do we use arrow as an assignment operator? by Colin Fay